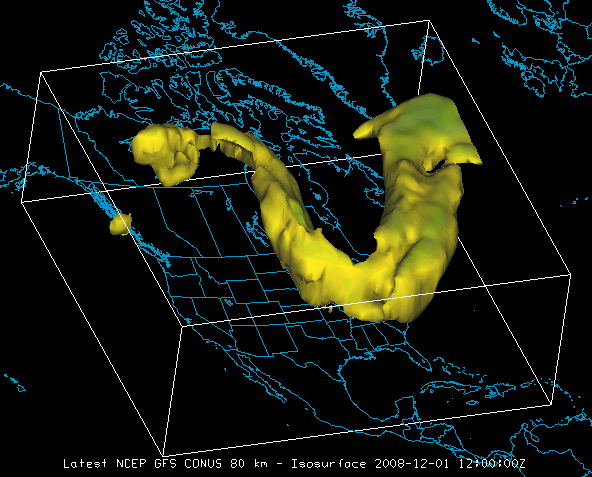
Image 1: 3D Surface Isosurface Display
An isosurface is a surface of a single value in a 3D parameter field. Isosurfaces are the 3D analog of a single-valued contour line in a 2D plot. The intersection of an isosurface and a plane is a contour line of the same value. Isosurfaces may form closed surfaces enclosing regions of higher or lower value, but not always.
McIDAS-V also supports isosurface displays that are colored from another parameter, not the parameter used to make the shape of the surface. The example here shows an isosurface of 89% relative humidity over North America colored by air temperature. A useful plot is to color isosurfaces by height (geopotential height) to show height of features by color.
All Isosurface displays display in the Main Display window, and their controls are in the Layer Controls tab of the Data Explorer. For more information about isosurface controls, see 3D Surface Controls.
For data sources that include topography or terrain data, such as the "terrain" parameter in NAM and RUC model output or DEM data, McIDAS-V can display a 3D relief map. Select "Topography" for the display type.
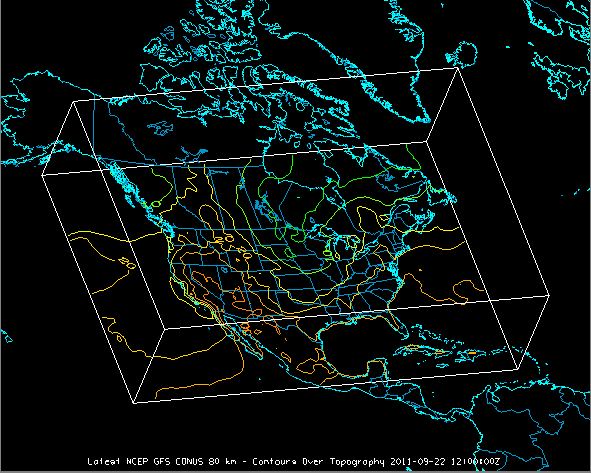
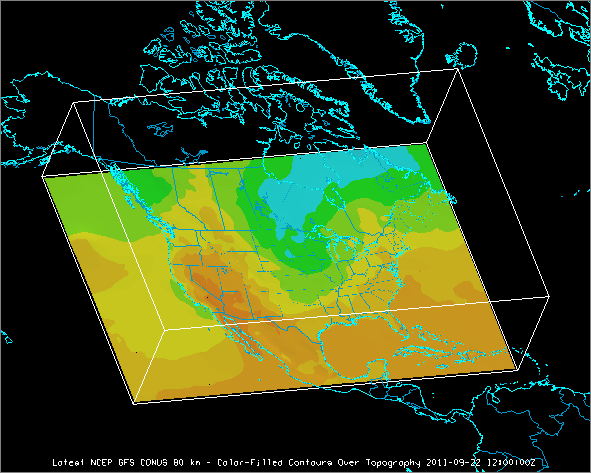
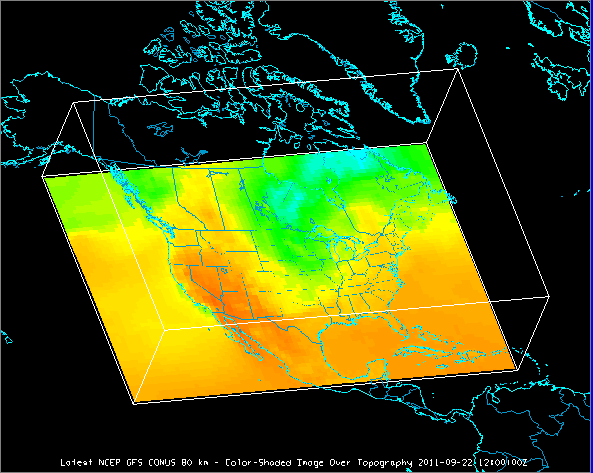
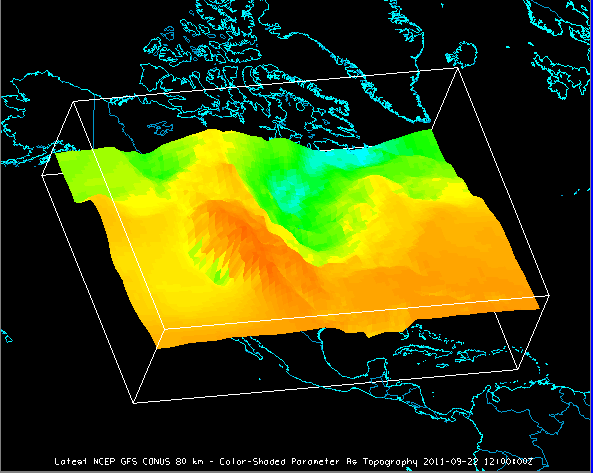
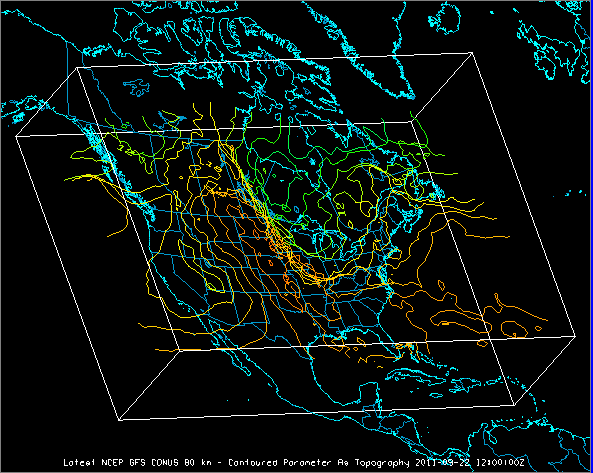
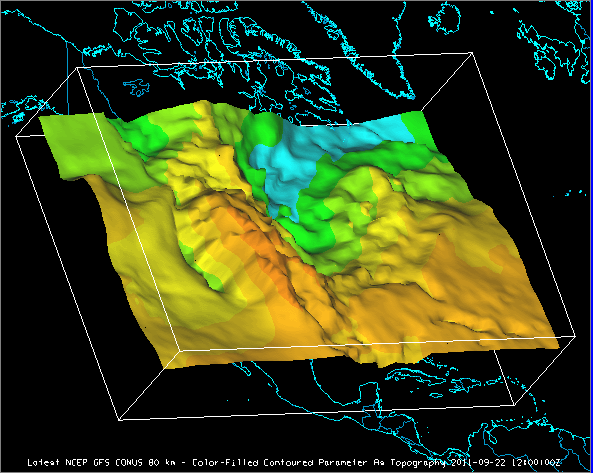
Two dimensional grid data can be draped over a topography field to provide a terrain following representation of the data.
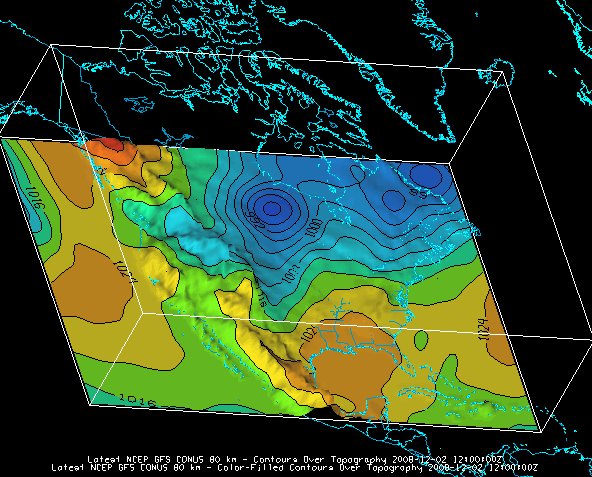
All topography displays display in the Main Display window, and their controls are in the Layer Controls tab of the Data Explorer. For more information about the the controls for these displays see 3D Surface Controls and Topography Controls.
For more information see Displaying Gridded Data.