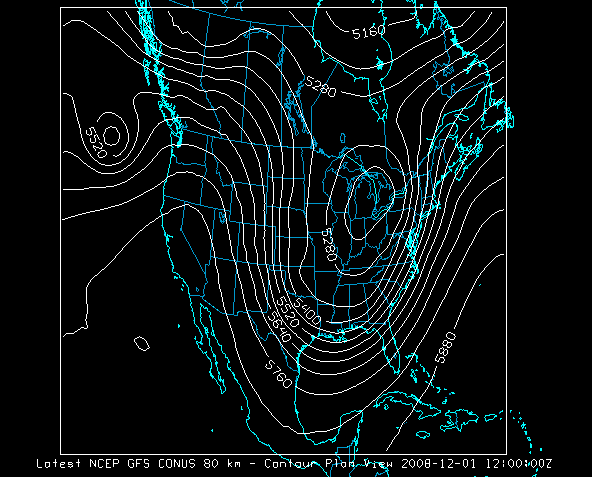
Image 1: Contour Plan View Display
A plan view is a flat, horizontal display of 2D data, or a horizontal cross section of 3D data. More simply, a plan view is a view from the top. These plan views are represented by contour lines used to display a parameter overlaying a base map. McIDAS-V offers the ability to shade or fill the spaces between the contour lines of the plan view display for further customization.

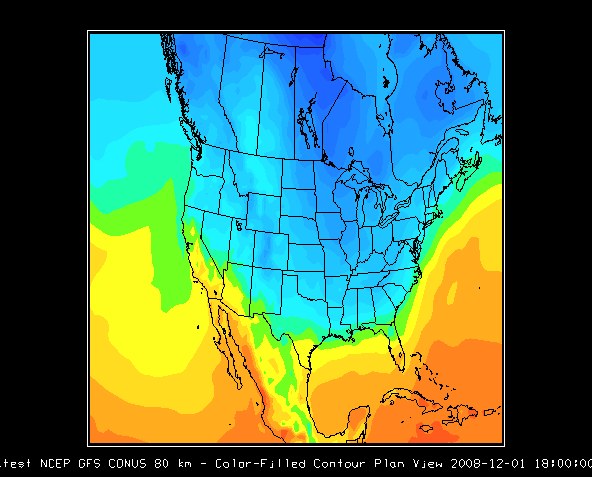
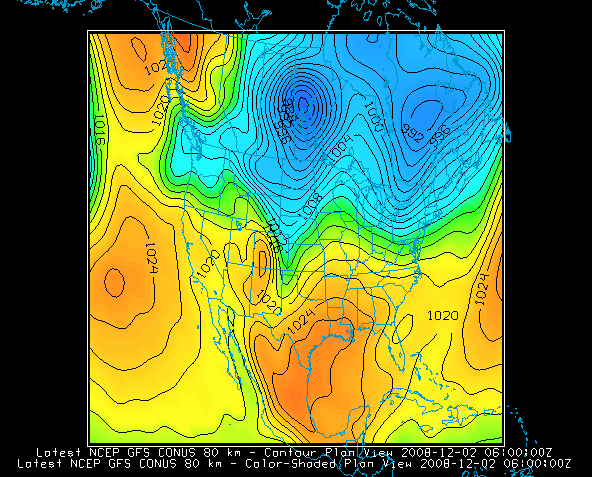
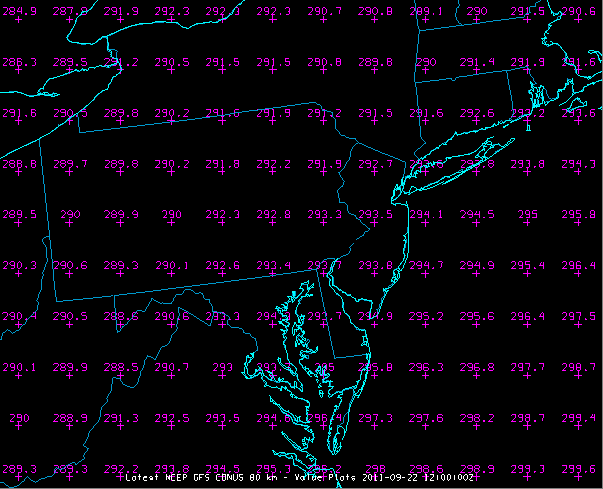
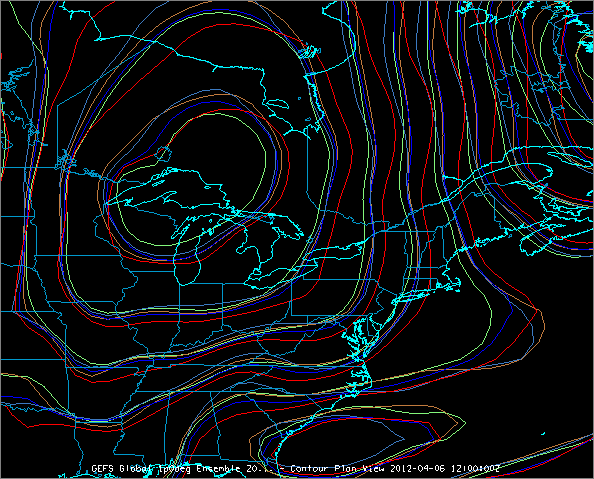
Plan views can be displayed in several ways:
Colors help distinguish values and subtle features, and if used carefully can be an intuitive indication of value and trend, such as using "hot" colors for higher or important values.
All of these displays display in the Main Display window, with their controls in the Layer Controls tab of the Data Explorer. For more information about the controls for the Plan Views, see Plan View Controls. For more information about the Value Plot display, see Value Plot Controls. For more information about the Ensemble Contour Plan View display, see Ensemble Grid Controls.
A McIDAS-V 3D Plan View can be set to any of the data levels in the data source, or between data levels, in which case interpolation is used to estimate the data values in the plan view. A colored square selector point in the left corner of the 3D plan view can be moved up and down by dragging the mouse button to re-position the level. You can make several 3D plan views at the same time for one or more parameters in 3D data. To learn how to make a display, see Displaying Gridded Data.