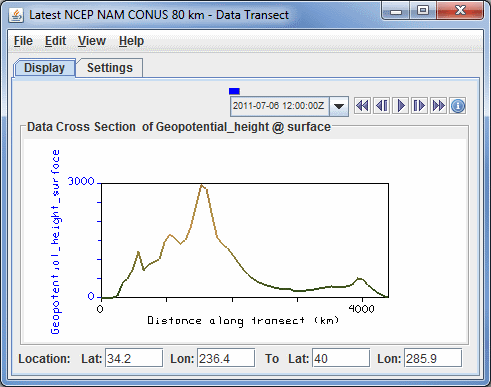
The Data Transect controls are used to adjust data transect displays. The control window includes a display of the profile of the data along the transect. The vertical axis is the parameter value and the horizontal axis is the distance along the transect line. In the Main Display window, a transect selector allows you to position the location of the transect by dragging the selector points along the line. The control window consists of two tabs, Display and Settings.
The Display tab shows the the profile of the data along the transect:

Image 1: Display Tab of the Data Transect Window
 Time Animation Control - Controls the looping of displays through time.
See more in Time Animation Control.
Time Animation Control - Controls the looping of displays through time.
See more in Time Animation Control.- Distance along transect - Depicts the horizontal distance the cross section covers in the Main Display window. This can be changed by left-clicking and dragging the end points of the data transect line in the Main Display window.
- Location - Shows the starting and ending points of the data transect line. You can change the endpoints of the data transect by entering in new values and hitting Enter.
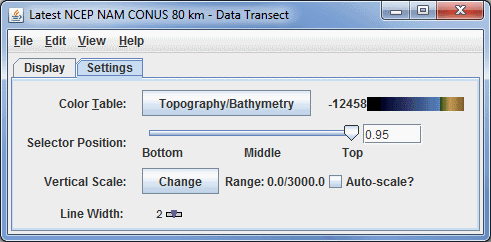
The Settings tab contains widgets for changing properties of that display:

Image 2: Settings Tab of the Data Transect Window
- Color Table - Shows the active color table and the associated high and low data values in the units of the display. As the mouse pointer is moved over the color bar, the value at a particular color is shown. Right click on the color bar or click on the button that displays the name of the Color Table to make modifications to the color bar. This allows you to open the Color Table Editor, change the range, select other color tables, etc.
- Selector Position - Changes the vertical position of the data transect line with respect to other variables being displayed in the Main Display window. This value can be changed with the slider or by typing a value into the field and pressing Enter.
- Vertical Scale - Modifies the vertical axis range. The Use Predefined option allows you to select a variety of predefined minimum and maximum vertical values for your chosen parameter. When the Auto-scale? checkbox is checked, the data transect will scale the Y-axis of the transect to the sampled data range.
- Line Width - Changes the width of the data transect line. Use the slider to change this value
Many of the menu items seen utilizing this display are standard options that can be found in the Menus section of the Layer Controls page. However, there are several options that are unique to this display.
The Edit menu has these unique options:
- Selector Color - Changes the color of the shape representing the location of the probe in the Main Display window.
- Change Parameter... - Opens a Field Selector window, which allows you to change the parameter you are displaying to a parameter from one of the added Data Sources.
- Change Display Unit... - Opens a Change Unit window, which allows you to change the unit of the parameter you are displaying.
The View menu has these unique options:
- Use Data Projection - Allows the user to change many aspects of the display shown in both the Main Display window, and in the Layer Controls tab of the Data Explorer.
- Enable Adaptive Resolution (Under Development) - Turns adaptive resolution on or off for the layer. This menu item is only available if adaptive resolution is enabled in the User Preferences. Note that adaptive resolution is still under development.
- Data Transect - Uses the standard Data Transect to display the Data Transect in the Layer Controls tab of the Data Explorer.