The track controls display trajectory data sets, e.g., aircraft track, ship, buoys, etc. This data can be loaded in the General->Files/Directories chooser of the Data Sources tab of the Data Explorer, with the Data Type of Track files. You can display your data in the form of a chart, table, or track drawn in the Main Display window.
To draw a track in the Main Display window, select the Track Colored By Parameter display type. The track controls consist of two tabs, Layout and Times.
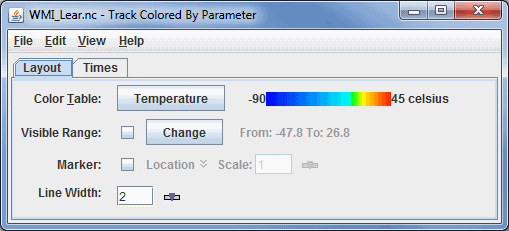
The Layout tab controls the appearance of the display:

Image 1: Layout Tab of the Track Controls Dialog
- Color Table - Shows the active color table and the associated high and low data values in the units of the display. As the mouse pointer is moved over the color bar, the value at a particular color is shown. Right click on the color bar or click on the button that displays the name of the Color Table to make modifications to the color bar. This allows you to open the Color Table Editor, change the range, select other color tables, etc.
- Visible Range - Allows you to set the range that determines
what parts of the data are actually shown. Check the box to enable the widget
and click
 to set the data range.
 - Marker - Defines an end point symbol and text as well as its color with
these fields. By default, "Location" is selected as the default
marker. Click the checkbox to the left of the "Location" box
to enable the marker. Click on "Location" to choose another marker
from the list of layouts. Click on the
 Edit icon
to edit a current layout, or to create a new one. Use the slider or enter
in a value and hit enter in the Scale option to set the
scale of the marker.
 - Line Width - Allows you to set the width of the displayed trajectory line. You can change the line width by typing a value into the field and pressing Enter, or by clicking
 to use a slider.
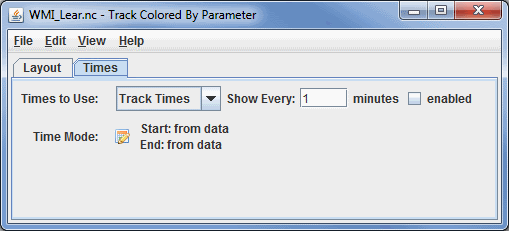
The second tab controls the Times used for the display:

Image 2: Times Tab of the Track Controls Dialog
- Times to Use - Represents if you are using nominal times or the track times from the data. You can also choose to limit the times of data shown by checking enabled.
- Time Mode - Allows for the control of how much of the track is shown and from what time. Even though a track represents a set of observation times, there is not
time set defined for animating in the main display. Click
 to show the Time Settings dialog. The time mode allows
for the control of how much of the track is shown and from what time. Select
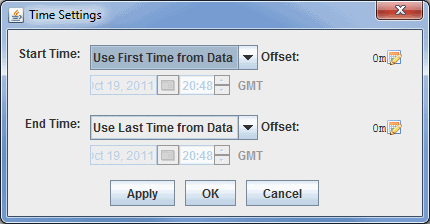
the Change button to show the Time
Settings dialog:

Image 3: Time Settings DialogThis dialog allows you to define the time range to show of the track. The image above defines that the end time is the current animation time. The start time is relative to the end time less 30 minutes.
This time setting is similar to that used for the general Define Animation Times tab.
- Change Parameter - Changes the parameter displayed by using the Edit->Change Parameter menu.
- Change Display Unit - Changes the unit of the parameter displayed by using the Edit->Change Display Unit menu.
Many of the menu items seen utilizing this display are standard options that can be found in the Menus section of the Layer Controls Page. However, there is one item that is unique to this display.
The View menu has this unique option:
- Show Flythrough - Opens the Flythrough feature which allows you to interactively explore the display.