Improving Severe Weather Predictions by Satellite
For sheer fear factor, few weather phenomena match the tornado. The size and ferocity of a hurricane packs a bigger overall punch, but the focused fury of the tornado seems almost personal. Add the fact that we usually have days of warning of an approaching hurricane and only minutes for a tornado, and it’s easy to understand the desire for quicker, more accurate tornado and major storm prediction.
Predicting and tracking these storms classically involved a combination of ground observation and radar, but geostationary satellite observations have already become vital to the effort.
This past spring, researchers from SSEC/CIMSS joined over one hundred researchers and weather forecasters at the National Weather Center in Norman, OK, for the NOAA Hazardous Weather Testbed (HWT) and at the Aviation Weather Center (AWC) in Kansas City, MO, for the Aviation Weather Testbed (AWT) experiments. The purpose of both the HWT and AWT is to bridge the gap between scientific findings and weather forecasting operations. Testbeds, initiated when the new Doppler and NEXRAD radars became operational, continue today and illustrate the benefits of satellite data acquisition to National Weather Service (NWS) forecasters.
Forecasters receive direct access to the latest research developments while at the same time helping scientists understand how best to create research strategies and maximize practical benefits.
Hazardous Weather Testbed and GOES-R Proving Ground
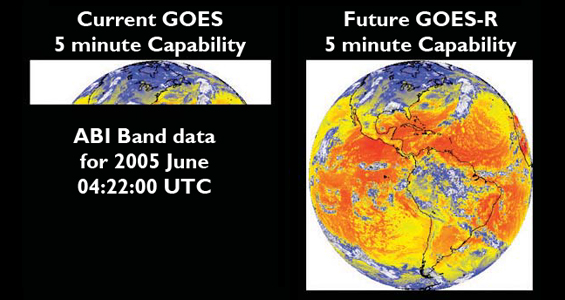
In 2015, the Geostationary Operational Environmental Satellite, R-Series (GOES-R), a string of four satellites, will be launched into orbit and begin a new era of satellite meteorology. Current geostationary satellites can gather 5 channels of data. However, the Advanced Baseline Imager, the primary instrument on GOES-R for imaging Earth’s weather, climate, and environment, will be able to view the Earth with 16 different spectral bands, including two visible channels, four near-infrared channels, and ten infrared channels. GOES-R will provide three times more spectral information, four times the spatial resolution, and more than five times faster temporal coverage than the current system.
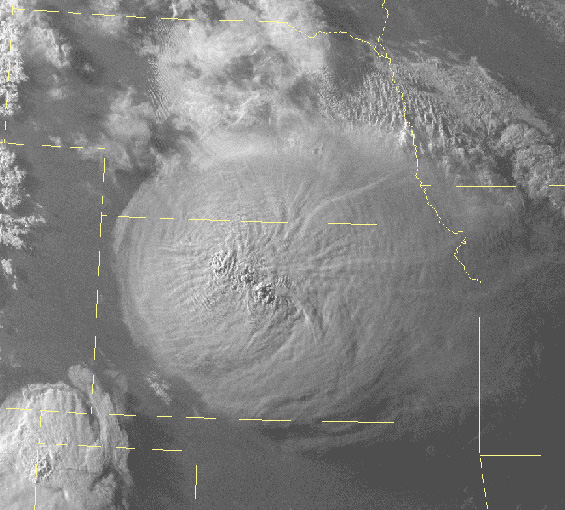
A satellite image of a supercell thunderstorm with overshooting tops over Kansas.
Credit: NWS 07 July 2004
During episodes of severe weather, ABI can show conditions every 30 to 60 seconds. The system in use now only shows them every 7.5 minutes. In normal mode, ABI will send readings over the continental U.S. every 5 minutes as opposed to every 15-30 minutes.
As part of the HWT, the GOES-R Proving Ground is a project in which simulated GOES-R products are generated using combinations of currently available GOES data, along with higher resolution data provided by instruments on polar-orbiting satellites such as MODIS on NASA’s Aqua and Terra satellites as well as model-generated synthetic satellite data.
This year, 16 visiting scientists and 28 NWS forecasters participated in real-time forecasting and warning exercises using several experimental GOES-R products generated from current satellite-based, land-based and numerical model-based datasets, including the UW-CIMSS cloud-top-cooling rate observations and nearcasting model, convective initiation nowcasting, total lightning detection, as well as numerical model-simulated satellite imagery.
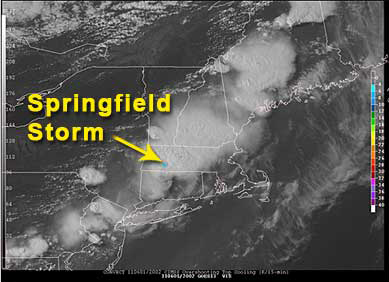
The GOES-R Overshooting Top Detection (OTD) algorithm identified an overshooting top at NOAA’s Hazardous Weather Testbed with the severe thunderstorm and tornado that struck in Springfield, MA on 01 June 2011. The OTD singled out the most intense thunderstorm cell out of a very large storm complex over Southern and Central New England. National Weather Service forecasters at the HWT Experimental Warning Program and Convective Initiation desk were alerted to the developing severe storm with 28 minute lead time before the first tornado report. Credit: NASA
NWS forecasters were excited by the potential of the demonstrated capabilities that will be available on GOES-R once it launches, with as many as 93% of the participants reporting high comfort levels in using the new products.
Aviation Weather Testbed
The AWT ran for two weeks in early June, and utilized eight new products, including the UW-CIMSS nearcasting model and cloud-top cooling rate observations. These products were demonstrated to the NWS forecasters and various FAA personnel in the Advanced Weather Interactive Processing System (AWIPS), the advanced processing, display, and telecommunications system that is the cornerstone of NWS operations.
Amanda Terborg, SSEC/CIMSS satellite liaison for the AWC, says, “The dedicated GOES-R desk at the Aviation Weather Center’s Summer Experiment was very much a success. We were very pleased with the myriad of comments we received, and with the in depth discussions that occurred at the GOES-R desk as well as with the other desks. Despite the unfamiliarity of the new products, our participants showed a willingness to learn and explore, and gave an overall positive response to the experience.”
No one can prevent hazardous weather, but with more accurate forecasts and longer warning lead times, some of the fear can be replaced with knowledge.
The HWT is held annually for five weeks in the spring in Oklahoma and the next AWT will be this coming February.


