Great Lakes ice: Monitoring ice cover and lake-effect snow
For cities on the Great Lakes – and the people who live in them – the impacts of annual lake-effect snow are all too familiar. At times they are inundated with feet of snow from a single system and at other times, no snow at all.
But as winter progresses and the Great Lakes begin to freeze over, the potential for lake-effect storms diminishes.
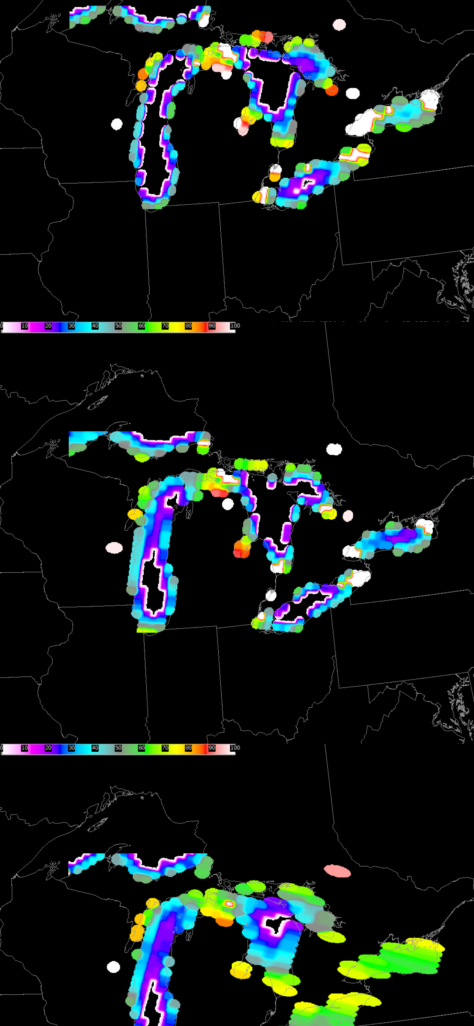
To help weather forecasters monitor ice formation on the Great Lakes – and better predict those lake-effect storms – SSEC scientist Scott Lindstrom and his colleagues provided a unique satellite product based on the MIRS Sea Ice Product that uses microwave, rather than visible or infrared imagery to measure ice concentration. They set out to apply existing data to solve an unmet need of forecasters.

“The genesis of the project came from the National Weather Service’s need to understand if the Great Lakes have frozen over for places like Buffalo, NY,” says Lindstrom. “Even a little open water can still have an impact and produce lake-effect events.”
Lake-effect snow requires certain conditions to form. It occurs when cold air rushes over a warm body of water and rapidly rises. The rising air cools and condenses into clouds which grow narrow and dense, eventually dropping precipitation over land.
Weather satellites have proven to be a useful tool for observing lake ice on cloud-free days, but they have some limitations on cloudy days thereby making it difficult to track the progress of ice formation.
The new product makes use of the Advanced Technology Microwave Sounder (ATMS) aboard the weather satellites NOAA-20 and Suomi NPP. They collect data in the microwave range of 22-180GHz, ranges that are much shorter than the longer visible or infrared wavelengths of other sensors, wavelengths that cannot penetrate clouds. Lindstrom says these data allow researchers to measure ice thickness regardless of the presence of overhead clouds, but it requires more than a single overhead pass from the satellites to create an accurate assessment.
As an example, if NOAA-20 passes over the middle of Lake Michigan on a Monday, by Tuesday the next image will be at a slightly different angle. This is due to the orbital mechanics of polar satellites, but Lindstrom says those differences are important for microwave observations, since even subtle differences can yield varying results. In total it takes 16 days until NOAA-20 will pass over that same location to capture a before-and-after image.
“To get an accurate assessment, it is best to have several days’ worth of data to compare and correct for varying view angles,” says Lindstrom. “We created these images using direct link download data from the satellites and the CIMSS Community Satellite Processing Package.”
This work was supported by the National Weather Service and NOAA.
