McIDAS-X Model Data Visualization
[ Satellite | Model | Observation | GIS Apps ]
McIDAS-X provides a robust suite of application tools for managing, processing, comparing and fusing data. Users access and integrate various data types by displaying images and graphics separately or simultaneously. Current, past and forecast data displays can be animated to monitor changes.
McIDAS-X:
- support for NCEP, ECMWF and other numerical model grids [see the SSEC Satellite Data Services for the current list]
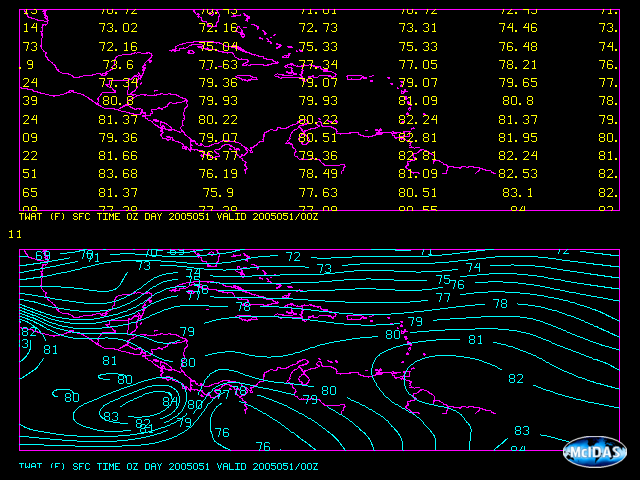
- plots and contours of gridded data in McIDAS GRID or netCDF format
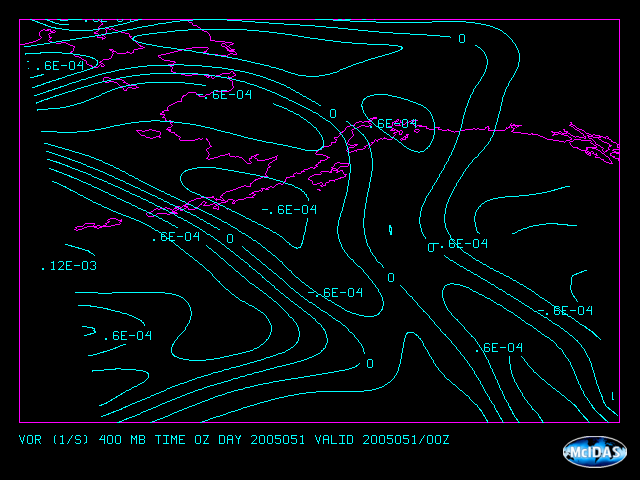
- derived fields – such as vorticity, divergence, parameter advection, shear
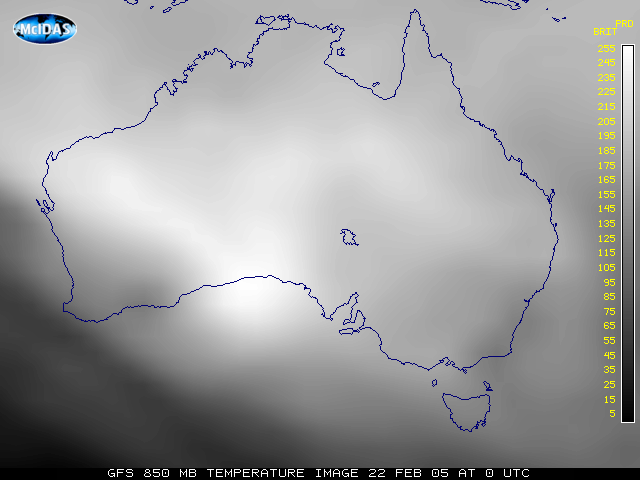
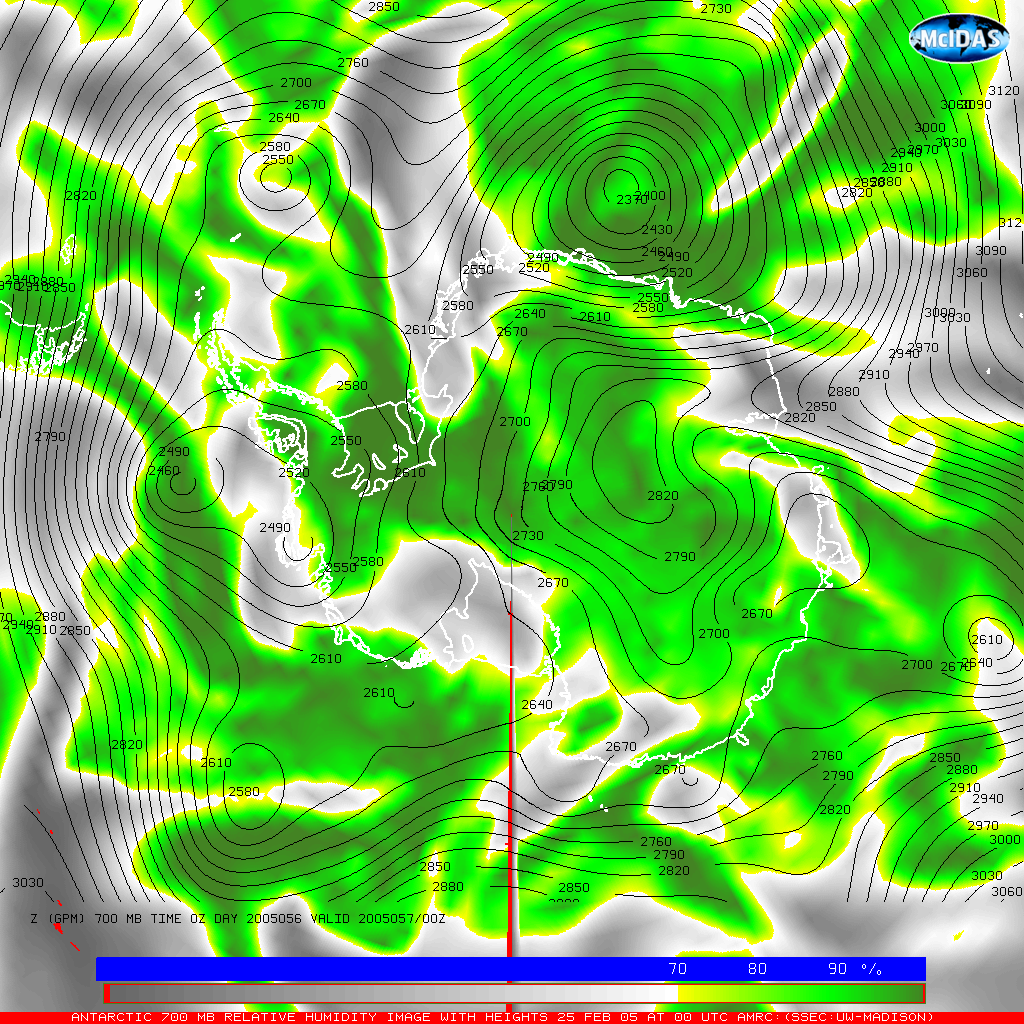
- convert gridded data fields into a digital image
- scalar operations between like grids using mathematical formulas
- list, modify and statistically analyze grid point values
[All examples on this page were created using McIDAS-X software. Some were created by members of McIDAS User Services and some were downloaded from sites listed on the SSEC Web page under “Research” or “Images and Data“]

Plots and contours of gridded data in McIDAS GRID or netCDF format [sea surface temperatures plotted and contoured]

Derived fields – such as vorticity, divergence, parameter advection, shear [vorticity over North Pacific]
Convert gridded data fields into a digital image [GFS 850 mb temperatures over Australia]
Convert gridded data fields into a digital image [GFS 700 mb relative humidity over Antarctica]


