McIDAS-X GIS Applications
[ Satellite | Model | Observation | GIS Apps ]
McIDAS-X provides a robust suite of application tools for managing, processing, comparing and fusing data. Users access and integrate various data types by displaying images and graphics separately or simultaneously. Current, past and forecast data displays can be animated to monitor changes.
McIDAS-X:
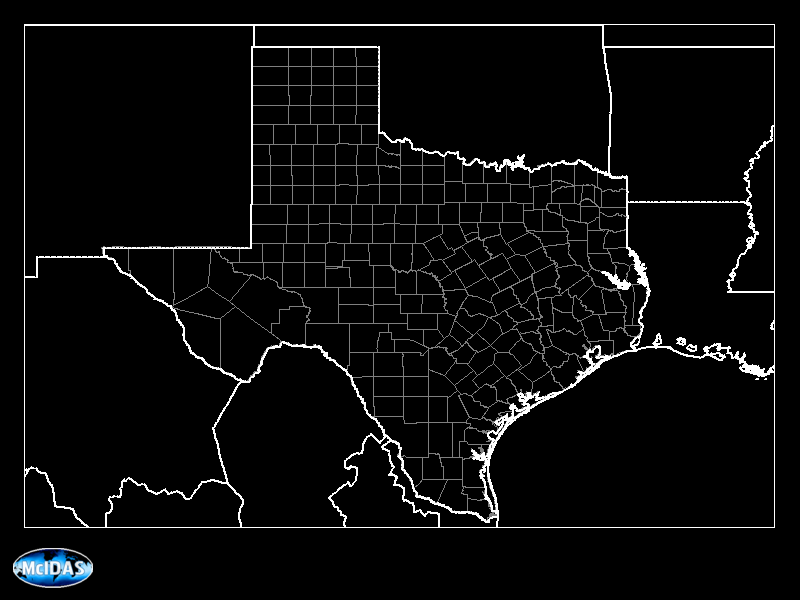
- plots major geopolitical boundaries: national, shoreline, state, county, National Weather Service state and marine zones
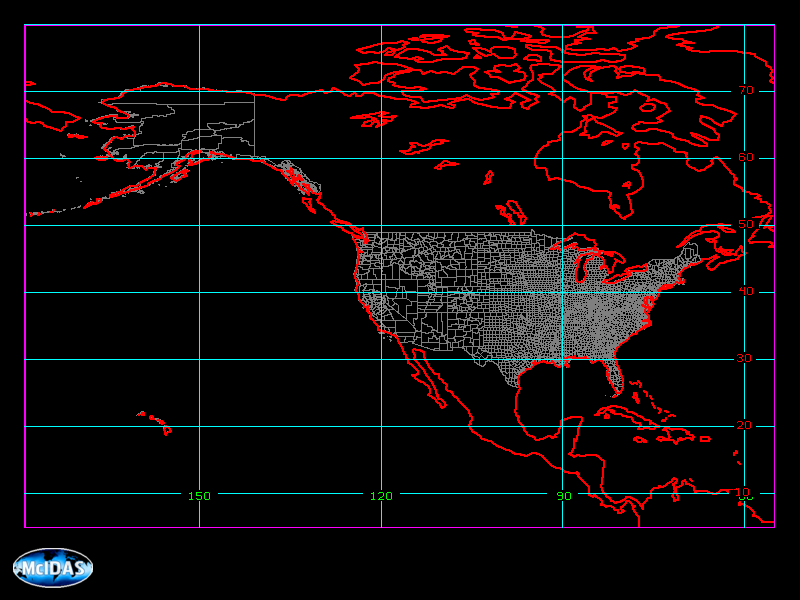
- plots latitude and longitude grids
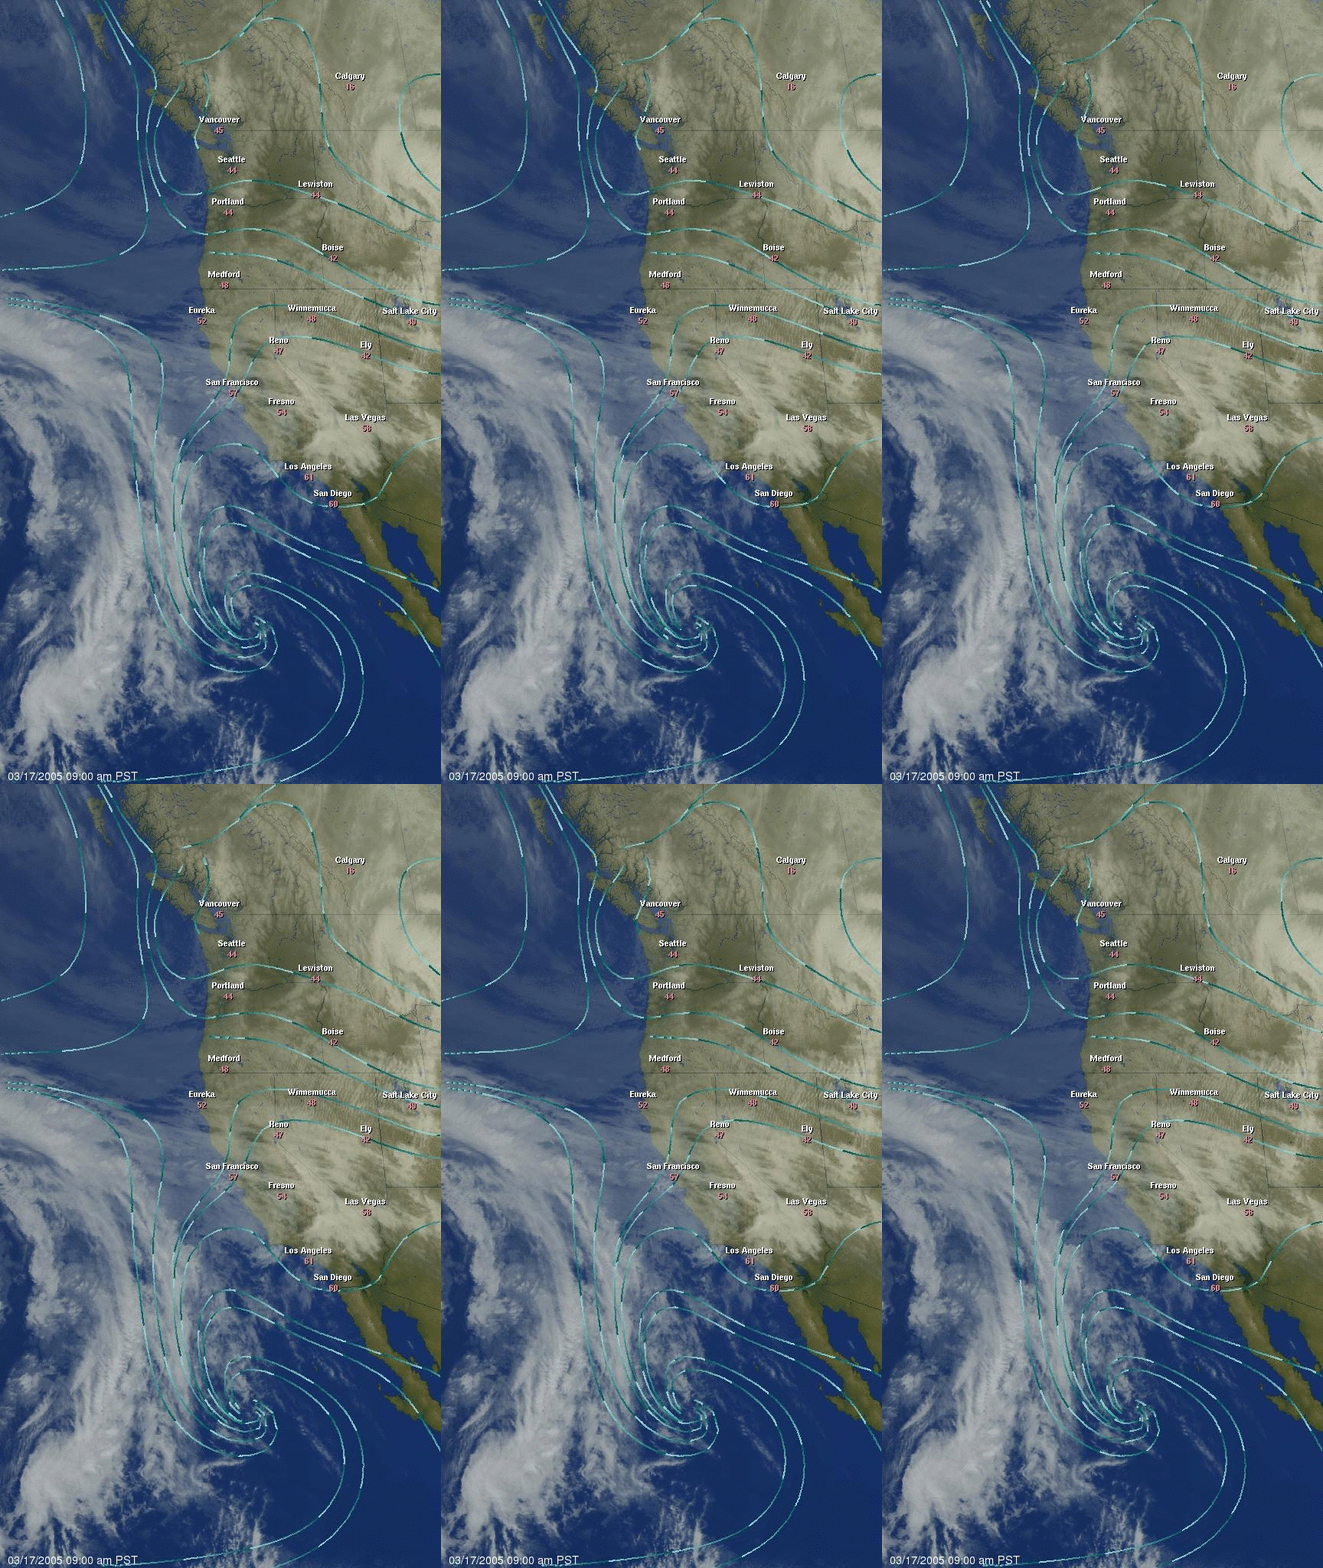
- combines satellite, radar, lightning data and other databases into a single, common projection
- reads native sensor projections: geostationary, polar orbiting, radar
- outputs images to GeoTIFF and netCDF data formats
[All examples on this page were created using McIDAS-X software. Some were created by members of McIDAS User Services and some were downloaded from sites listed on the SSEC Web page under “Research” or “Images and Data“]

Combinations of satellite, radar, lightning data and other databases into a single, common projection [surface streamlines and temperatures over satellite image]
Major geopolitical boundaries: national, shoreline, state, county, National Weather Service state and marine zones [Texas counties and northern Mexican states]
Latitude and longitude grids [North America]


