McIDAS-V Satellite Imagery Examples
[Satellite | Model | Radar | Observation]
McIDAS-V can display geostationary and polar orbiting satellite data from around the world. Users can interrogate individual pixels from multi and hyperspectral satellite data, create a scatter analysis of two fields, and plot time series. Channel differences can be computed for RGB, NDVI, or other derived products. Overlaying images from multiple satellites allows for easy creation of composites, and the powerful remapping capabilities make integrating satellite data with other meteorological and geophysical data simple for even the novice user.
The examples below demonstrate some of the capabilities of McIDAS-V with satellite data. Click on the image to view a larger version. If applicable, a link to the example bundle is also provided for interactive use in McIDAS-V.
[All examples on this page were created by members of the McIDAS User Services using McIDAS-V software.]
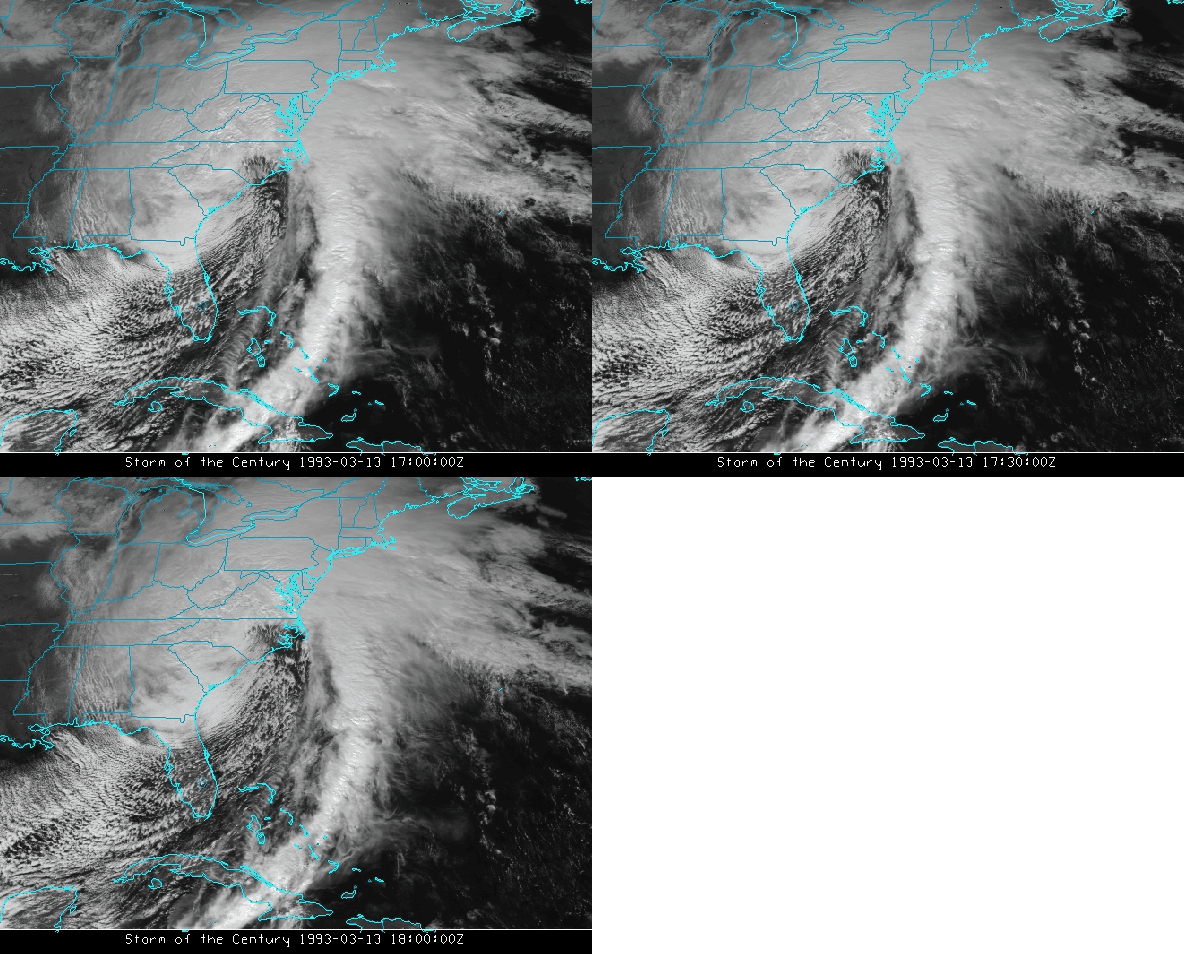
A visible loop over the Eastern United States during the Storm of the Century in 1993. (Bundle)
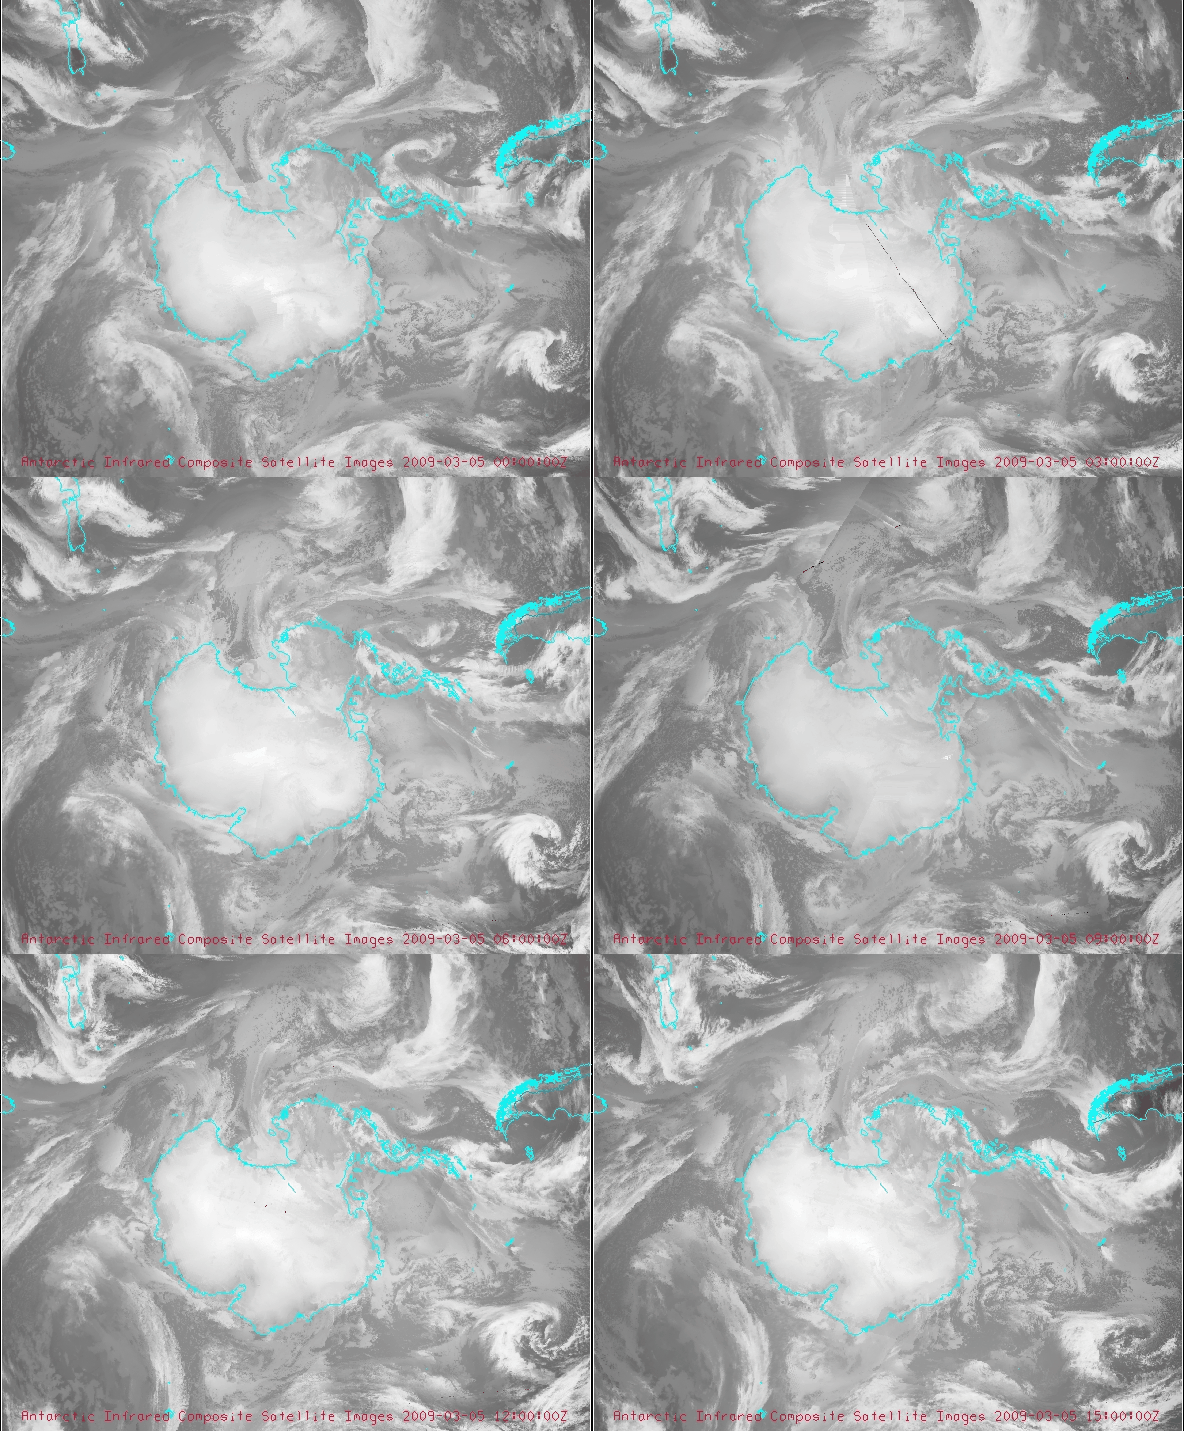
IR loop of Antarctic composite satellite images — a combination of geostationary and polar orbiting data. (Bundle)
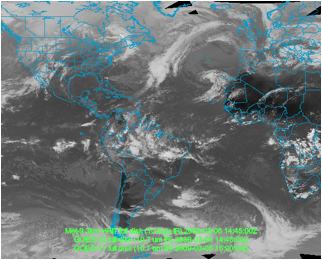
Composite IR satellite image using data from GOES-East, GOES-West and MSG. (Bundle)
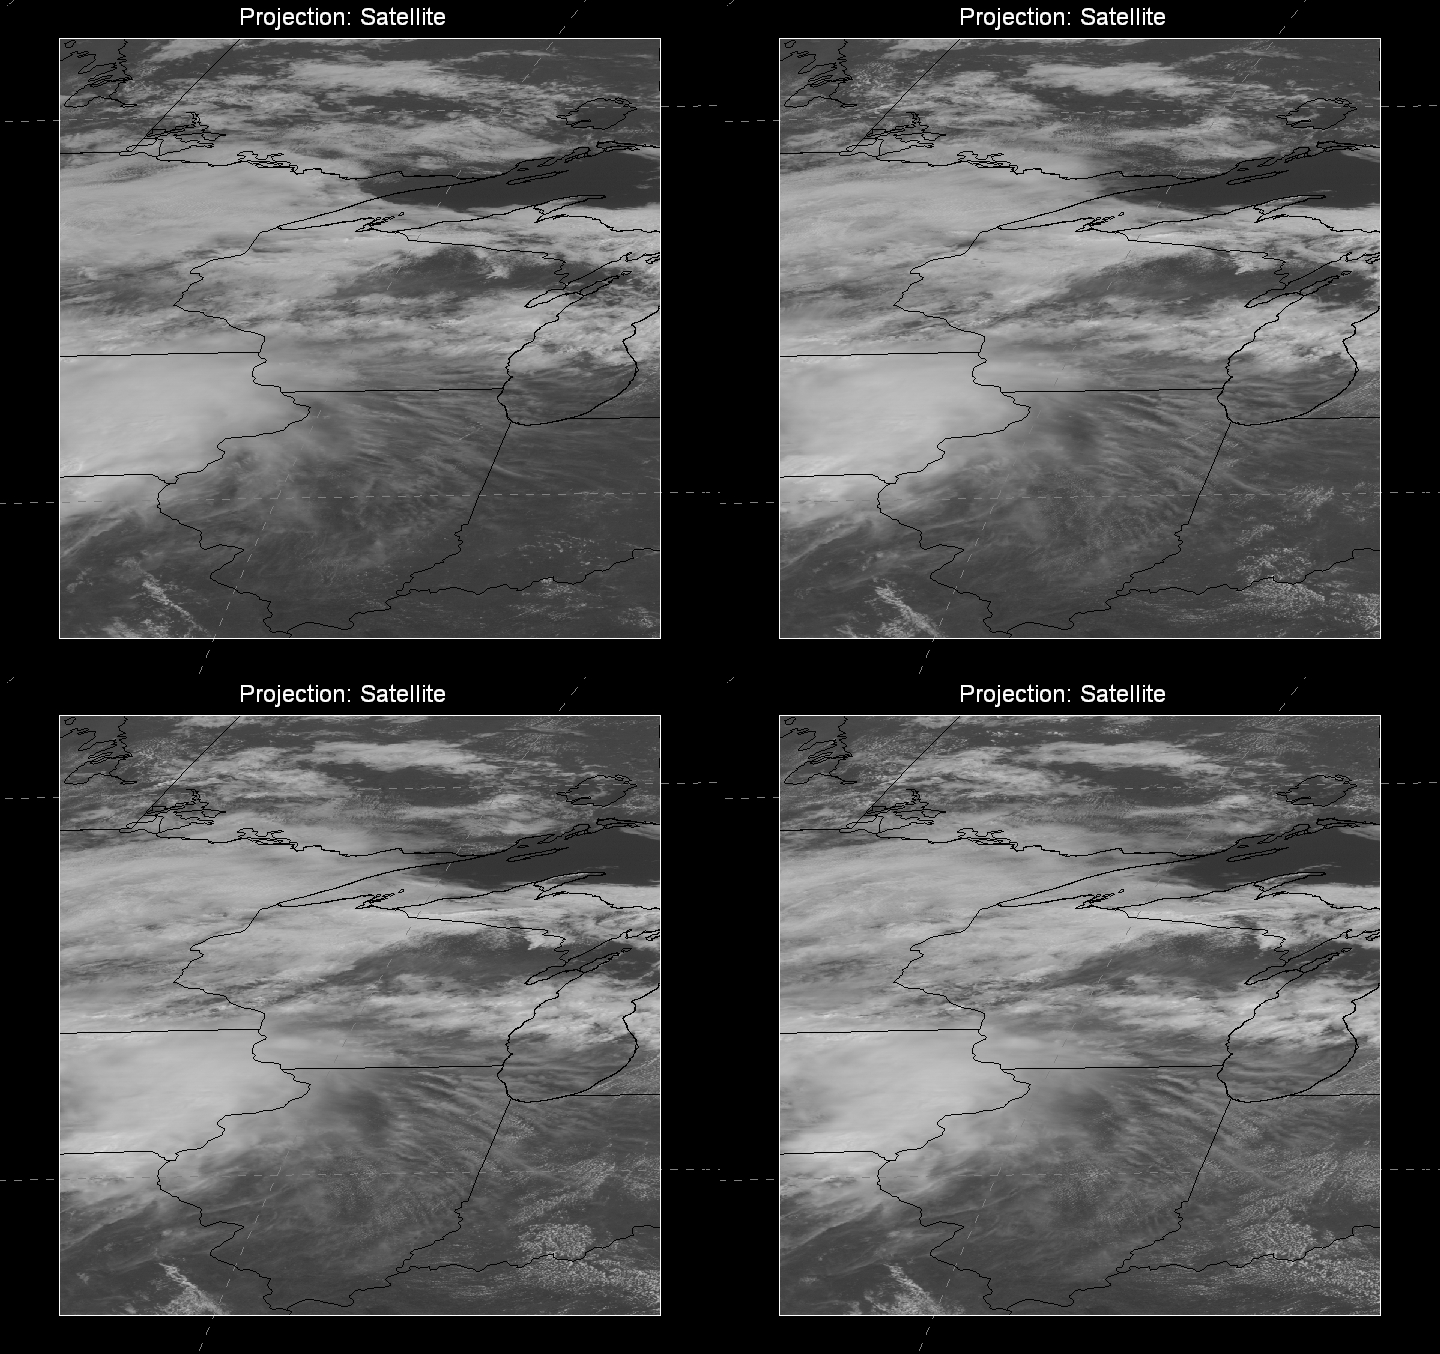
A two panel display showing a satellite image with the default satellite projection on the left and the Northern Hemisphere projection on the right. (Bundle)
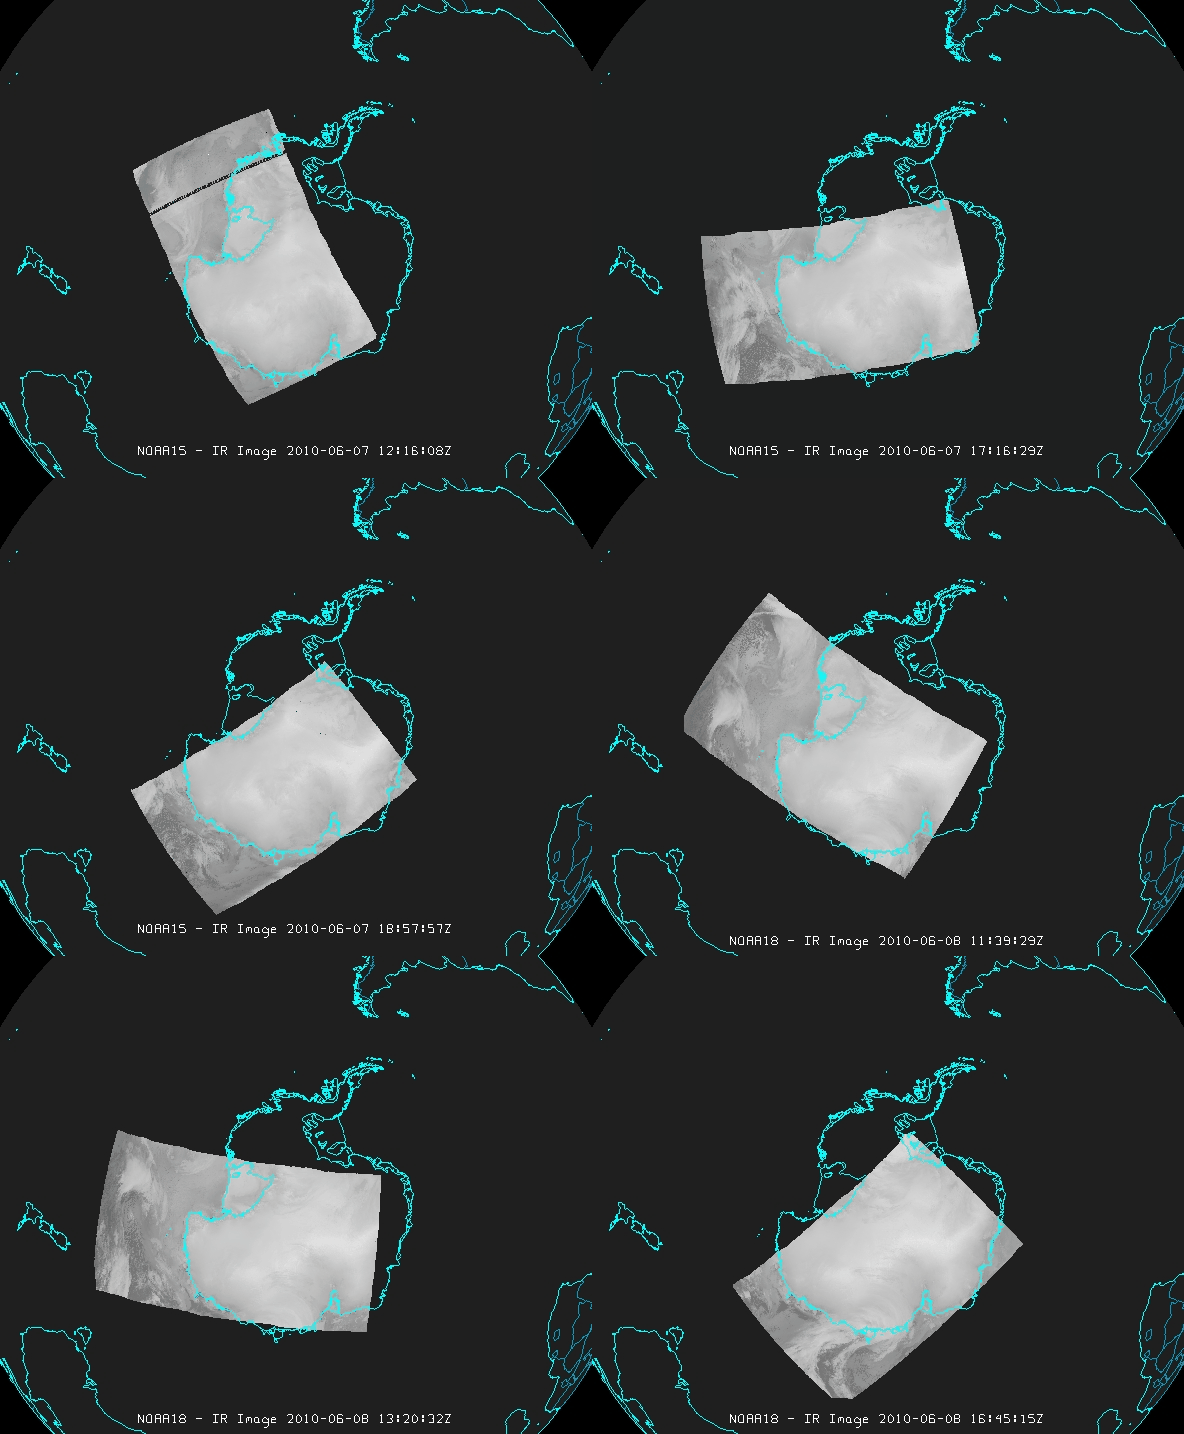
POES satellite images over Antarctica on the Globe Display. (Bundle)
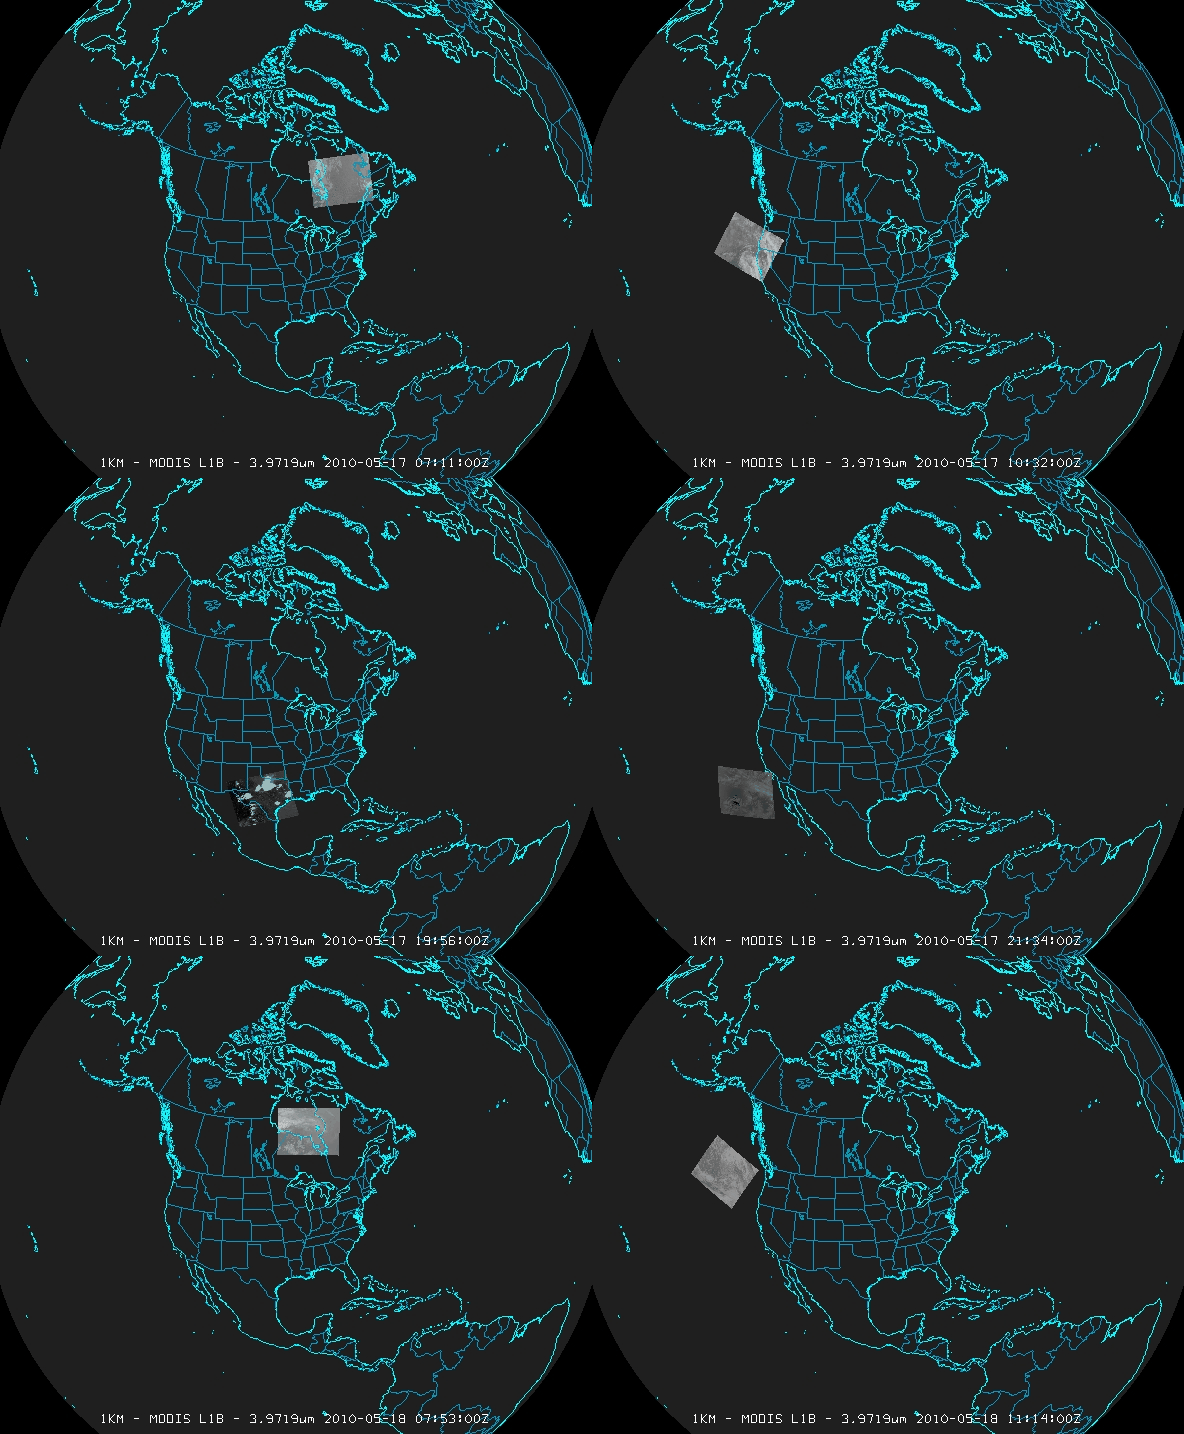
Polar-orbiting satellite images overlaid on a globe display. (Bundle)
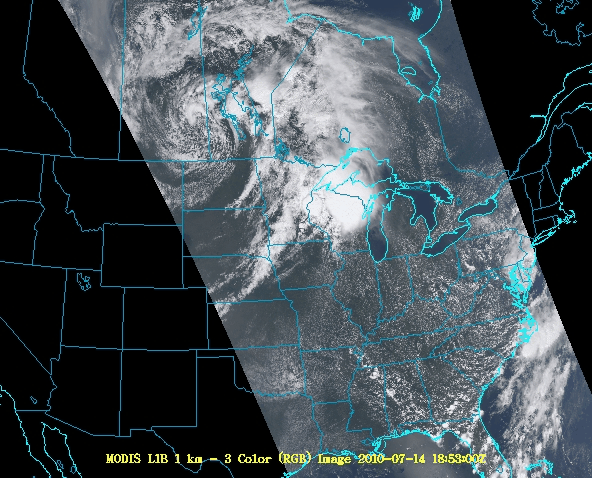
MODIS satellite data over the US in color using the three color rgb formula. (Bundle)
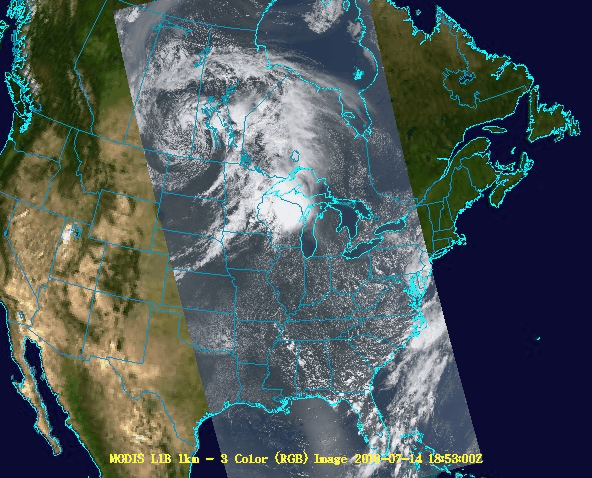
MODIS satellite data displayed on the Globe Display in color using the three color rgb formula. (Bundle)
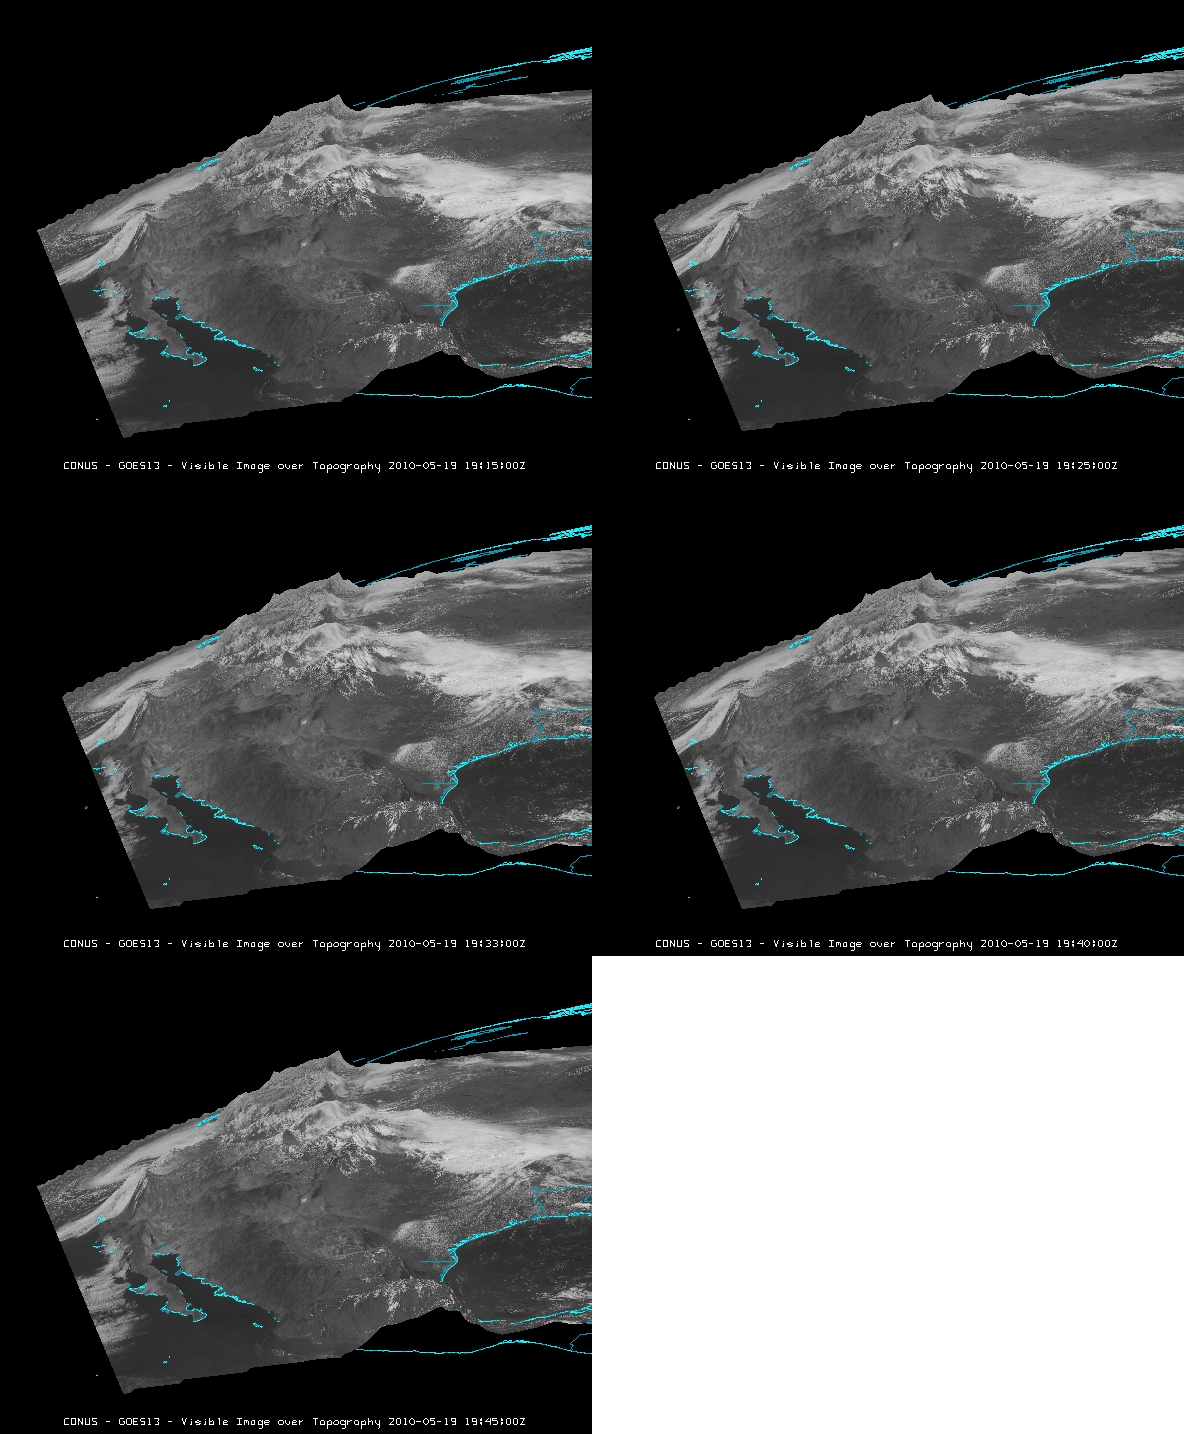
Visible satellite image in 3D displayed over the Rocky Mountains. (Bundle)

GFS model wind vectors displayed over an IR image in the western US and eastern Pacific. (Bundle)
