McIDAS-V Model Data Visualization
[Satellite | Model | Radar | Observation]
McIDAS-V can display gridded datasets from satellite and numerical model data. Gridded fields can be displayed and looped in 2- and 3- dimensions, at different levels in the atmosphere or draped over topography. Display types consist of filled and shaded contours, wind barbs, flow vectors, and isosurfaces. Multiple methods of data interrogation include cross sections, data probes and time series. Powerful mathematical tools allow for user-created formulas and scatter analysis for easy analysis and manipulation of the data. The remapping and overlaying capabilities of McIDAS-V make integrating gridded data with other meteorological and geophysical data simple for even the novice user.
The examples below demonstrate some of the capabilities of McIDAS-V with gridded data. Click on the image to view a larger version. If applicable, a link to the example bundle is also provided for interactive use in McIDAS-V.
[All examples on this page were created by members of the McIDAS User Services using McIDAS-V software.]
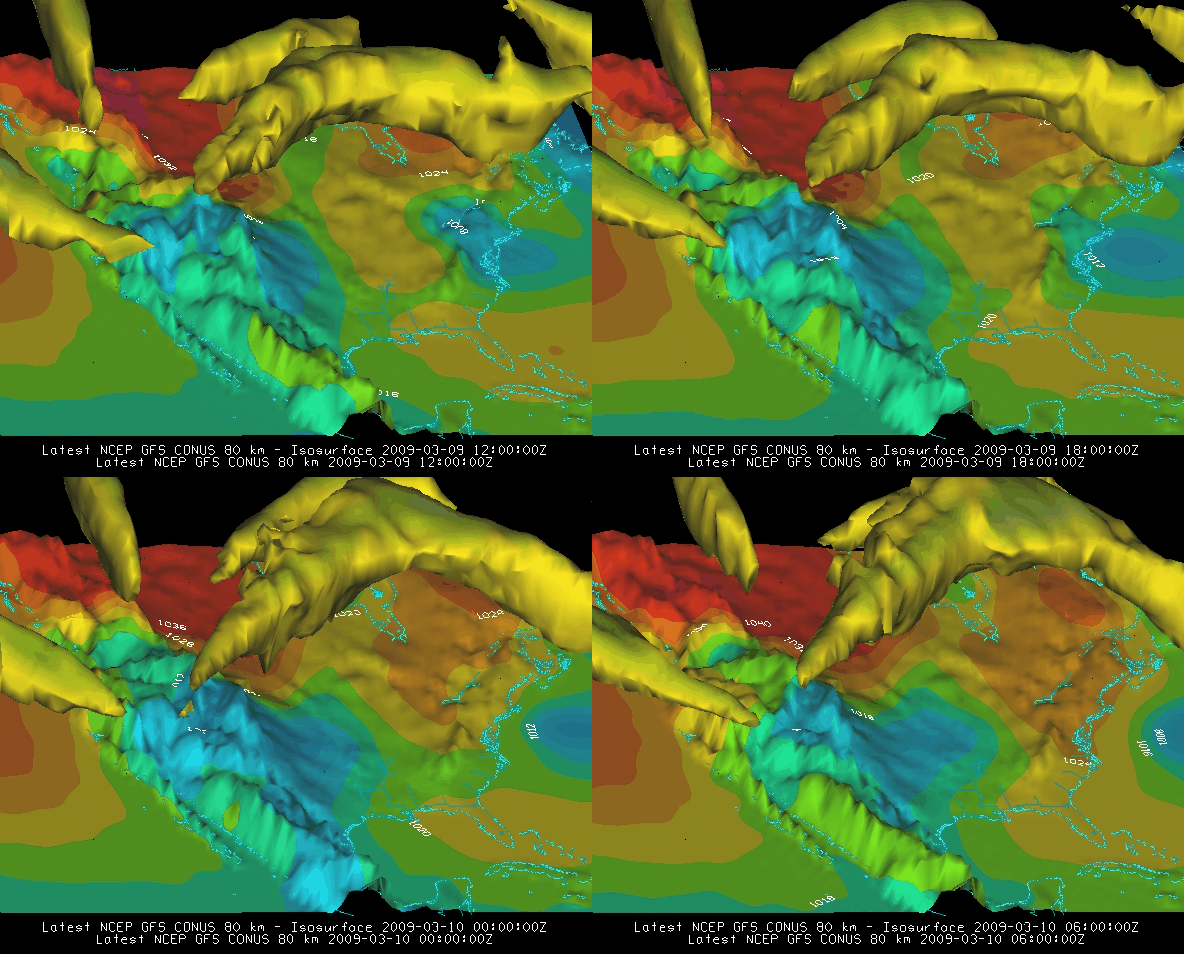
Color filled contours of pressure reduced to MSL displayed over topography with an isosurface of speed from the GFS model.
(Bundle)
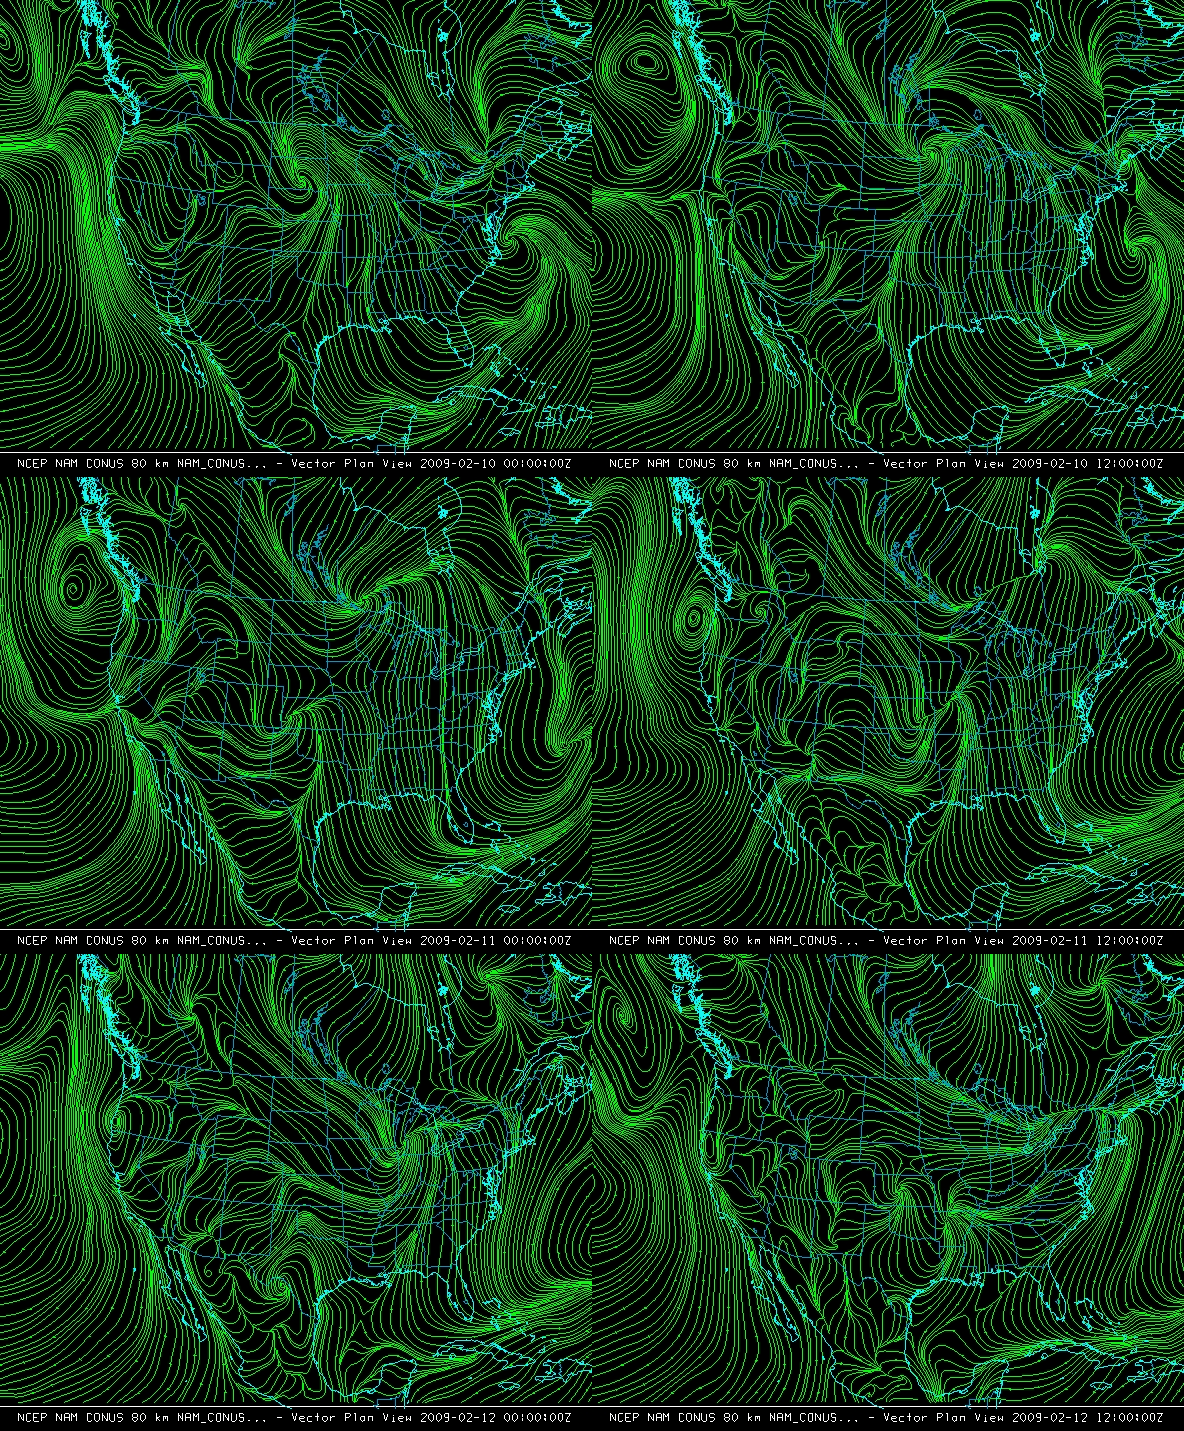
Surface streamlines from the GFS model.
(Bundle)
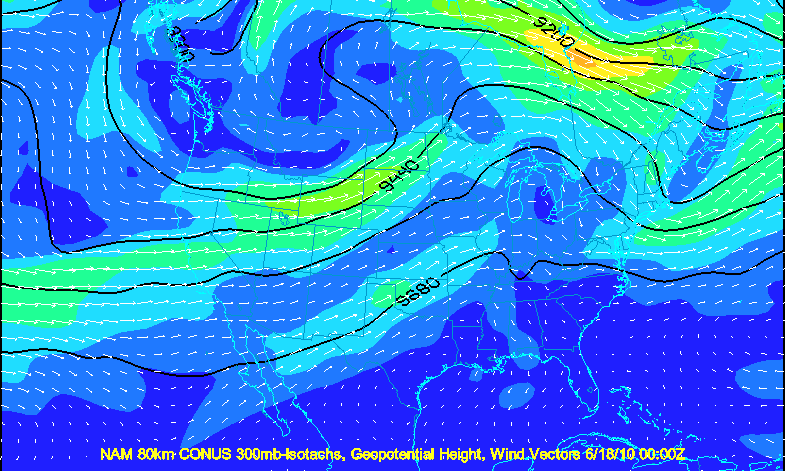
4 panel image of 300mb isotachs, geopotential height, and wind vectors from the NAM 80km CONUS model. (Bundle)
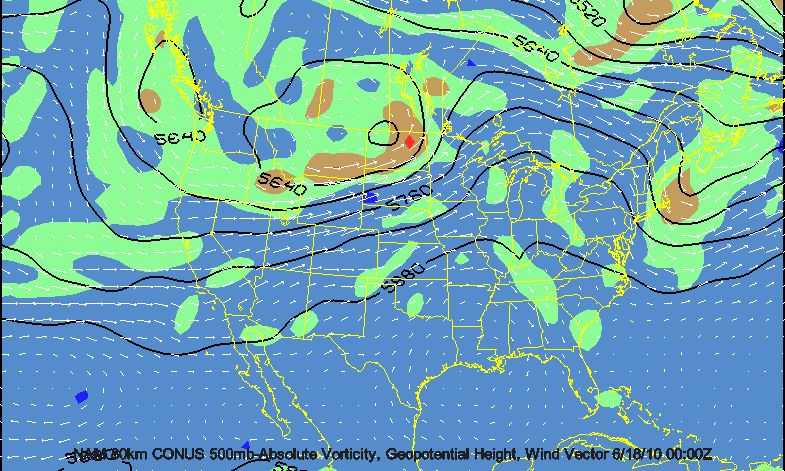
4 panel image of 500mb absolute vorticity, geopotential height, and wind vectors from the NAM 80km CONUS model. (Bundle)
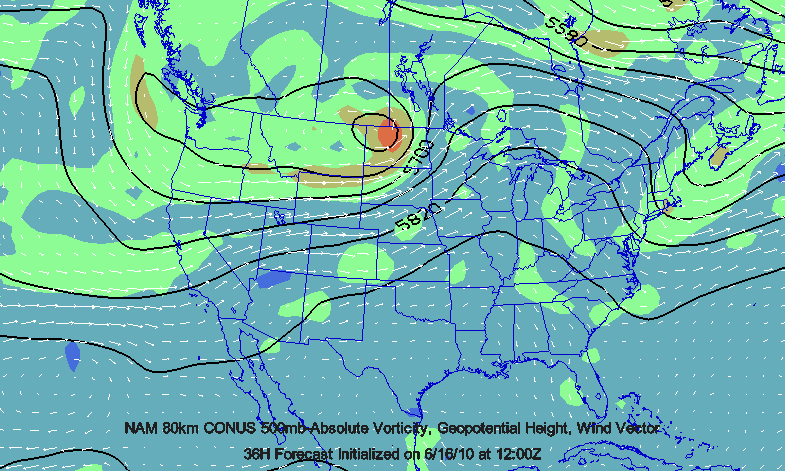
4 panel image of 500mb absolute vorticity, geopotential height, and wind vectors from four different forecast times. (Bundle)
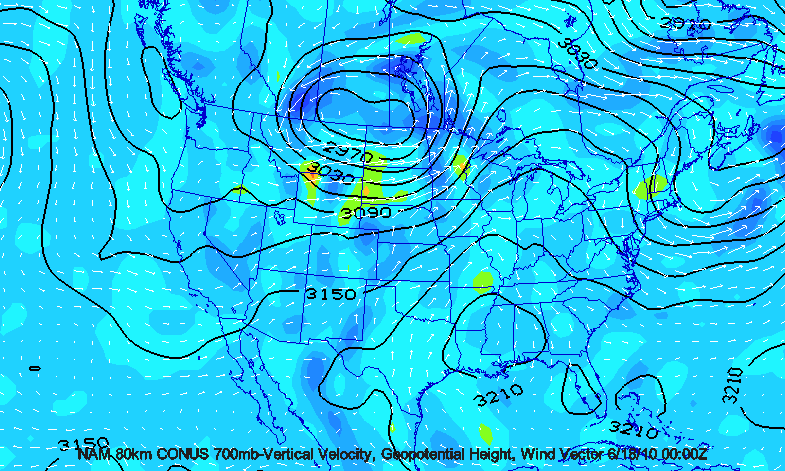
4 panel image of 700mb vertical velocity, geopotential height, and wind vectors from the NAM 80km CONUS model. (Bundle)
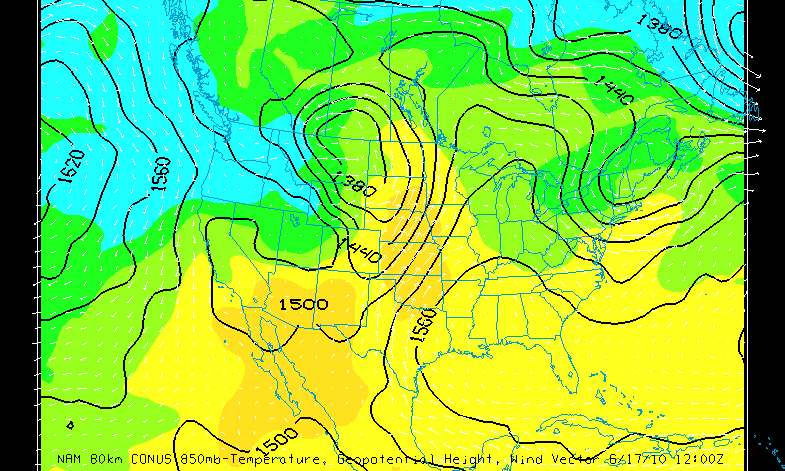
4 panel image of 850mb temperature, geopotential height, and wind vectors from the NAM 80km CONUS model. (Bundle)
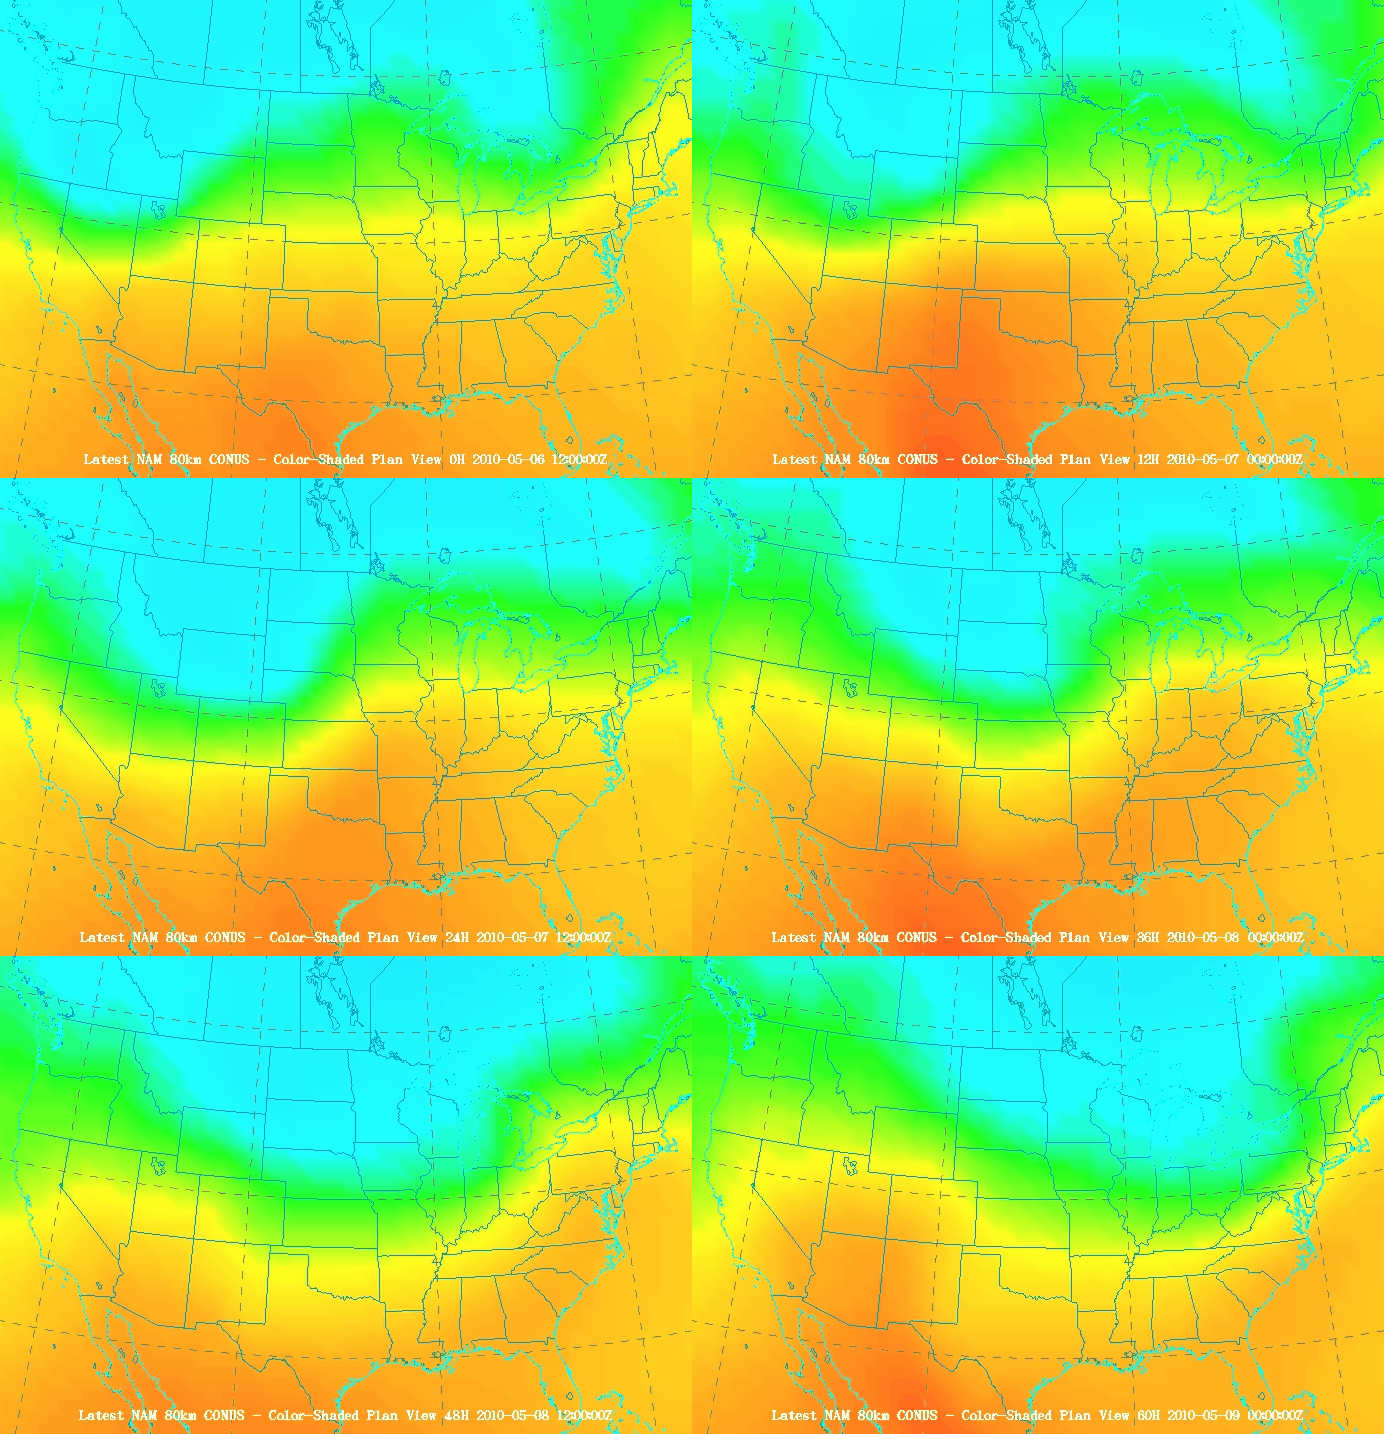
A color-shaded plan view of 1000-500 thickness. (Bundle)
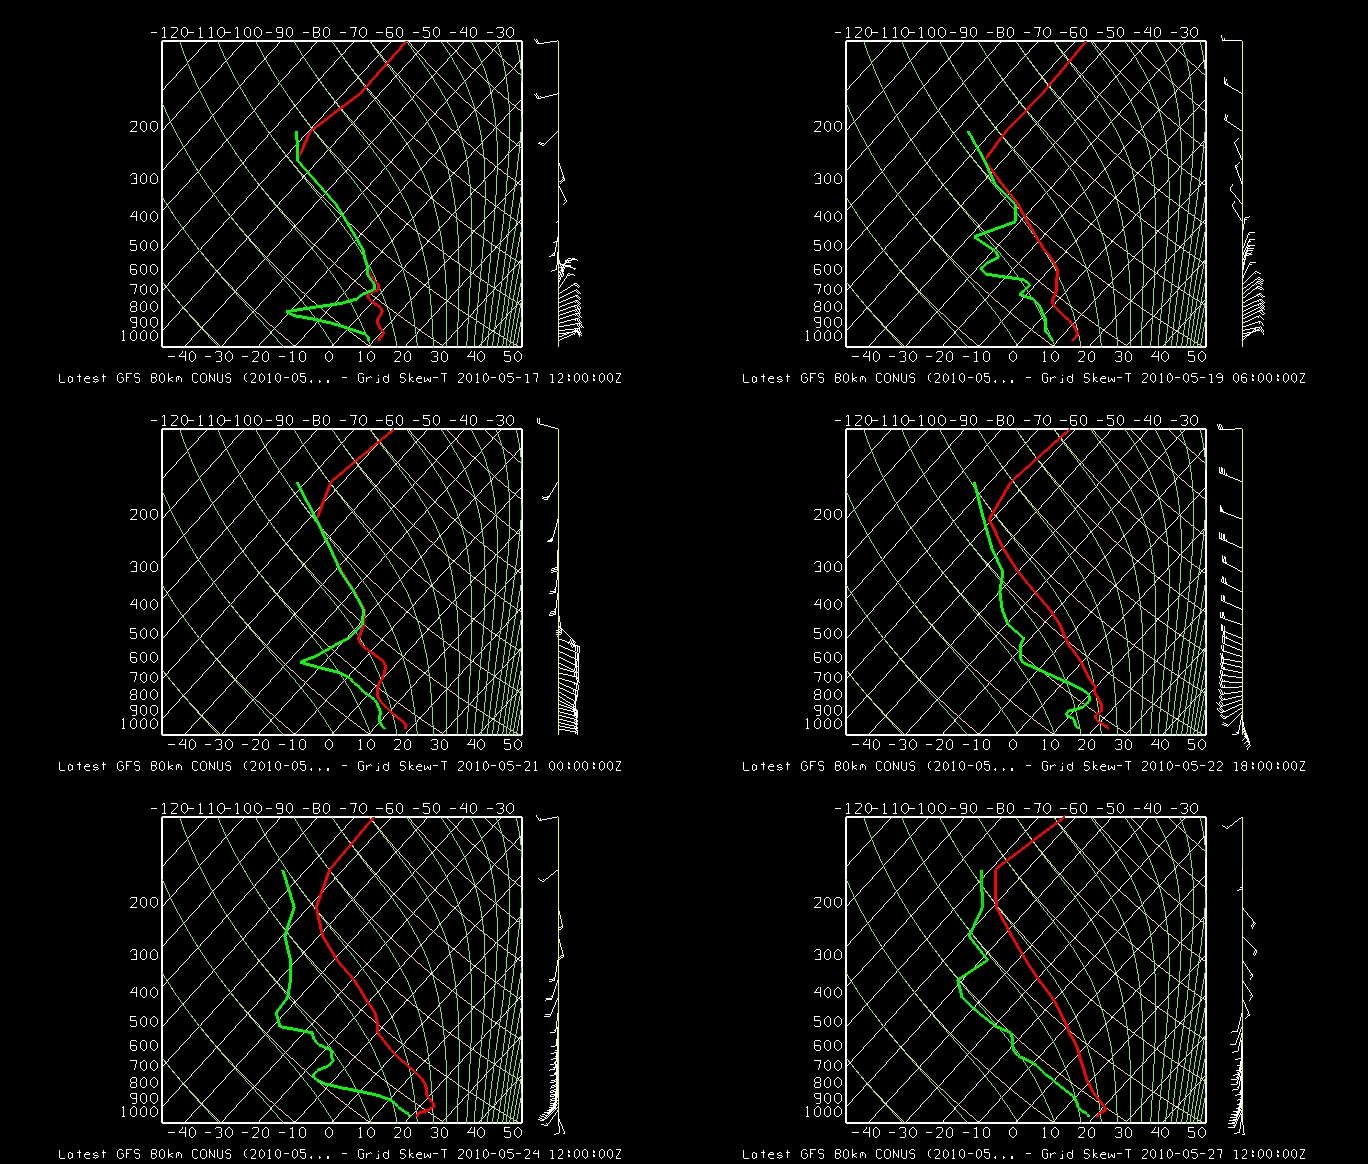
Gridded sounding data. A sounding and hodograph can be seen in the Layer Controls. (Bundle)
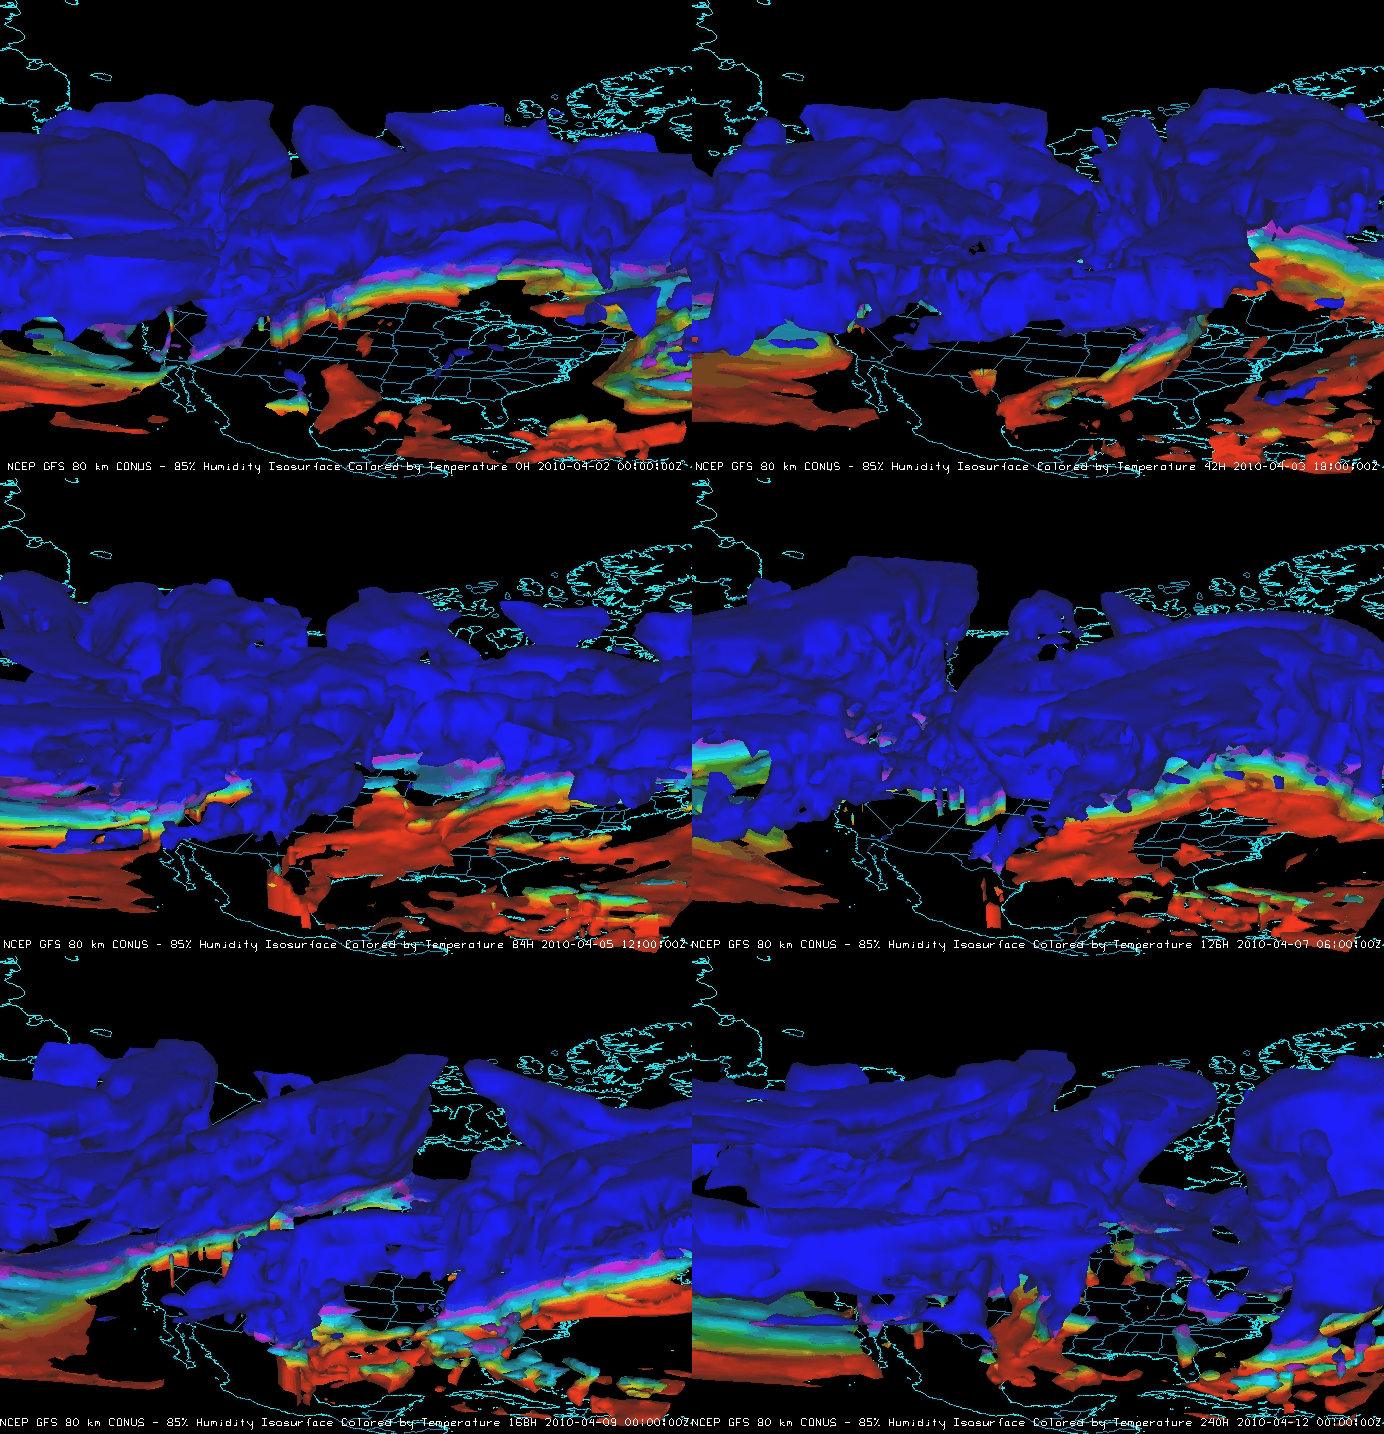
Isosurface of 85% humidity colored by temperature (-4 to 10 degrees C). The freezing point of water is colored pink. (Bundle)
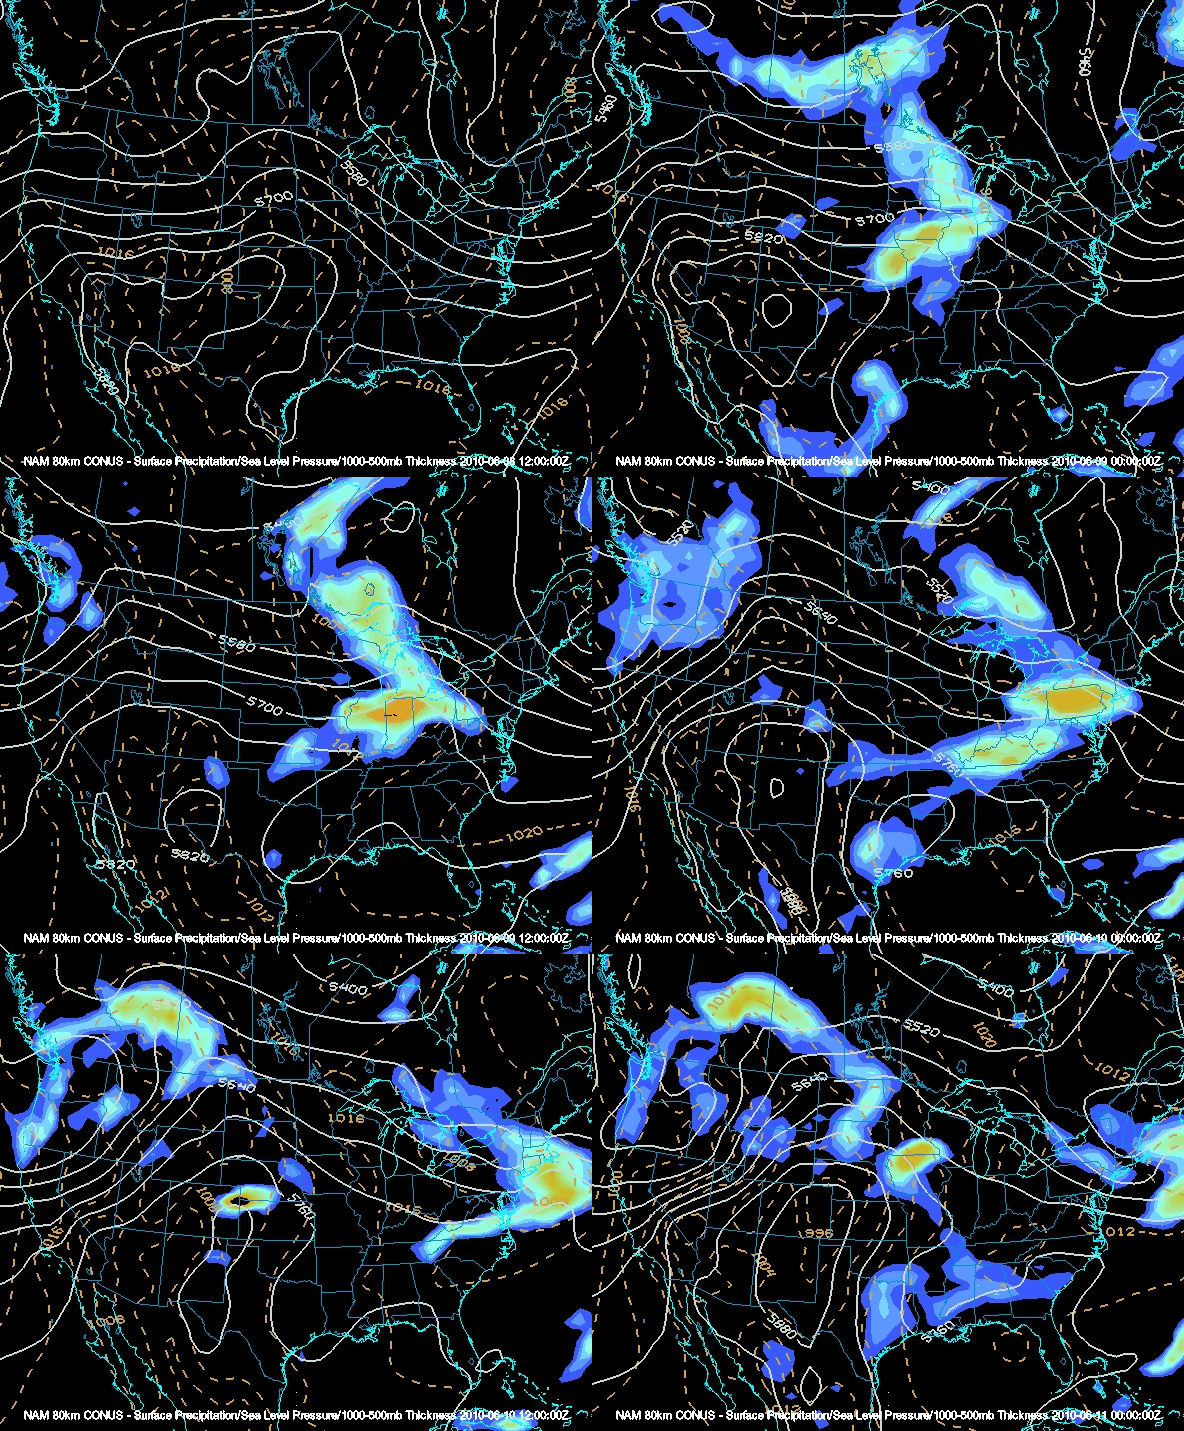
Gridded NAM data of surface precipitation, sea level pressure, and 1000-500mb thickness with sea level pressure represented as dashed lines. (Bundle)
