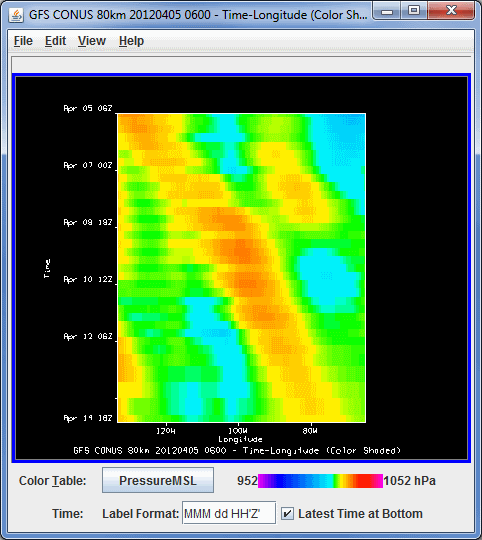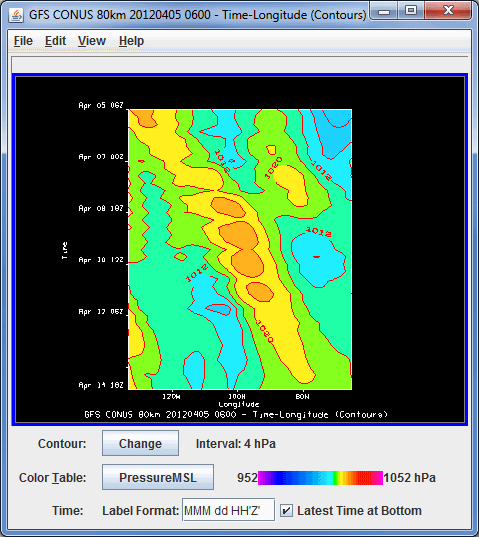
Image 1: Color Shaded Display
The Hovmoller display plots grid and gridded point data in a diagram with the Latitude/Longitude component on the X-axis, and the time component on the Y-axis. You can display the data with respect to either Latitude or Longitude, and as a Color Shaded or Contour view.


For more information about the Hovmoller Display, see Hovmoller Controls.