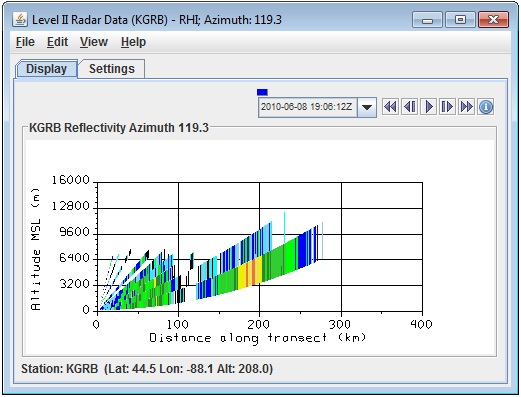
The RHI (Range-Height Indicator) display appears in the Main Display window and as a 2D plot in the Layer Controls tab. WSR-88D Level II Radar data has three moments or data types: Reflectivity, Radial Velocity, and Spectrum Width, indicated by the icon in the Field Selector. WSR-88D Dual Pole radar includes these three moments, as well as DifferentialReflectivity, CorrelationCoefficient, and Differential Phase. In order for RHI to be listed as a valid Display Type in the Field Selector, one of the moments (ex. Reflectivity, RadialVelocity, etc.) must be chosen in the Fields panel, not one of their individual elevation angles. The control window contains
two tabs, Display and Settings.
The Display tab shows the RHI in 2D:

Image 1: Display Tab of the Radar RHI Display Controls
 Time Animation Control - Controls the looping of displays through time. See more in Time Animation Control.
- Distance along transect - Depicts the horizontal distance the covered by the radar in the Main Display window. This can be changed by left-clicking and dragging the end points of the cross section in the Main Display.
- Station - Shows the station Location ID, Latitude, Longitude, and Altitude.
The Settings tab shows settings to control the display:
Image 2: Settings Tab of the Radar RHI Display Controls
- Color Table - Shows the active color table and the associated high and low data values in the units of the display. As the mouse pointer is moved over the color bar, the value at a particular color is shown. Right click on the color bar or click on the button that displays the name of the Color Table to make modifications to the color bar. This allows you to open the Color Table Editor, change the range, select other color tables, etc.
- Selector Position - Changes the vertical position of the selector line in the Main Display window. You can change this value by using the slider or by typing a value into the field and pressing Enter.
- Vertical Scale - Changes the vertical axis range of the RHI line in the Display tab. To change this value, click
 to open a Change Vertical Axis Range window, where you can enter in new minimum and maximum values for the axis.
 - Autorotate RHI - Starts and stops autorotation of the RHI in the Main Display window. The 2D
plot changes with the 3D RHI display when autorotate is on. Start the rotating by clicking
 and stop the rotation by clicking
  .
.
Many of the menu items seen utilizing this display are standard options that can be found in the Menus section of the Layer Controls page. However, there are a couple of options that are unique to this display.
The View menu has this unique option:
- RHI - Offers options to capture an image or movie and to change many Display Window preferences.
The Edit menu has this unique option:
- Selector Line Color - Selects the color of the selector line controlling the RHI azimuth in the Main Display window.