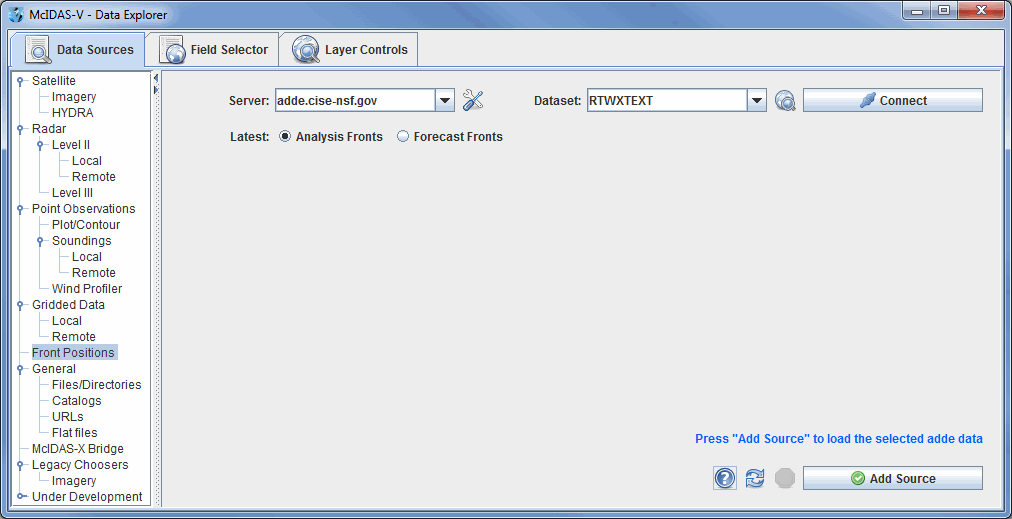
Image 1: Data Sources Tab of the Data Explorer
This section describes how to make plots from the NOAA National Profiler Network.
In the Data Explorer window, select the Data Sources tab. On the left side of this tab, select Front Positions from the list of available choosers. For more information about the fronts chooser, see Choosing Front Positions.

In the Server: and Dataset: entry boxes, use the pull down lists to select a remote server and dataset containing front data, such as adde.ucar.edu and RTPTSRC, and connect to the server.
Select either analysis or forecast fronts and click the ![]() button. The fronts will automatically plot in the Main Display window.
button. The fronts will automatically plot in the Main Display window.