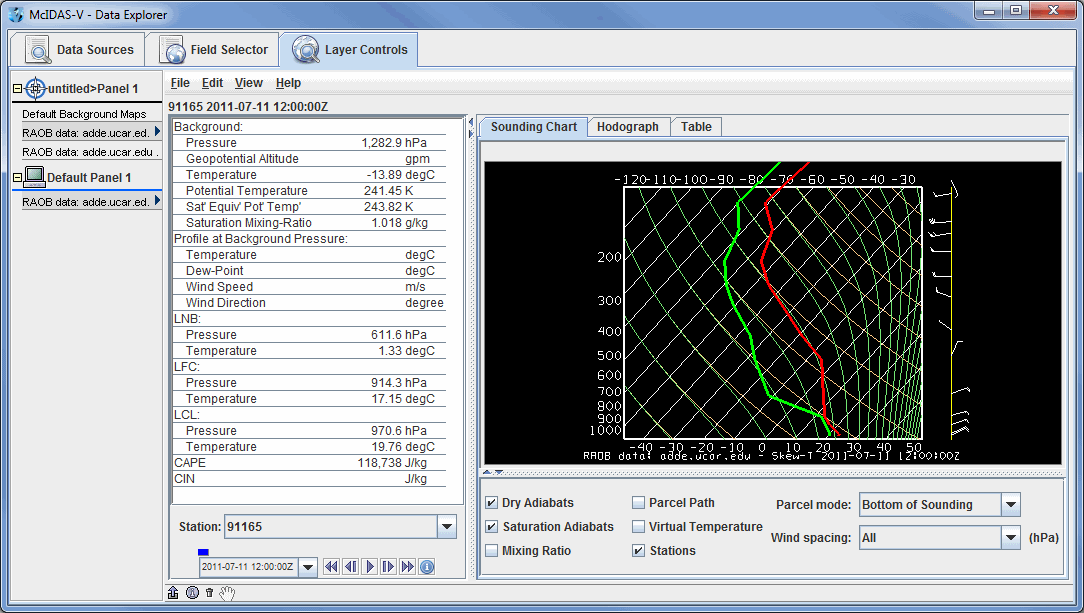
Image 1: Skew-T Display in the Layer Controls Tab of the Data Explorer
This section describes how to make Skew-T plots from RAOB data.

The set of steps include:
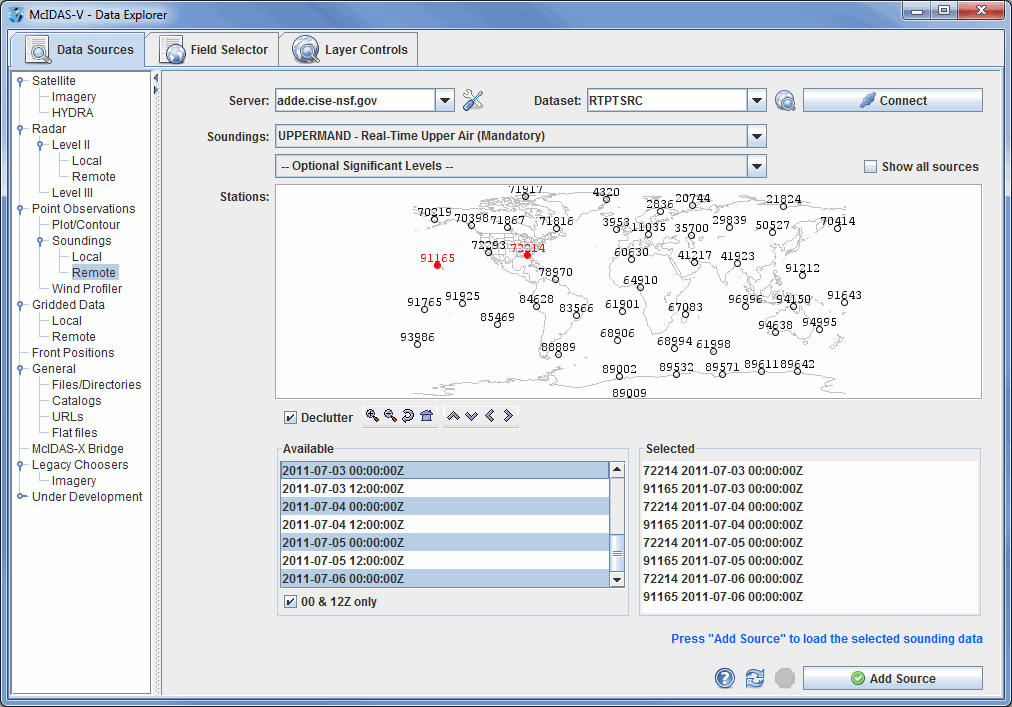
In the Data Explorer window, select the Data Sources tab. On the left side of this tab, select Point Observations->Soundings->Remote. For more information about the soundings chooser, see Choosing Upper Air Sounding Data.

For the Server and Dataset, select adde.ucar.edu and RTPTSRC and click Connect. You must select UPPERMAND for real-time upper air mandatory data, and you have the option to also select UPPERSIG for real-time upper air significant data for the Soundings category. The stations that match your conditions will be displayed in the map. Select the station(s) you want to use. You can select one or more stations by clicking on them; hold down the Ctrl key to select more than one. When the Declutter checkbox is checked, only stations that do not overlap will be shown. When in declutter mode you can zoom in (by dragging the left mouse) to see more stations. The icons below the map allow you to navigate the map.
After you select your station(s), select the available time(s) you want to view in
the Available box. The list of available soundings will be
displayed in the Selected box. When you have made your selection
click the ![]() button.
button.
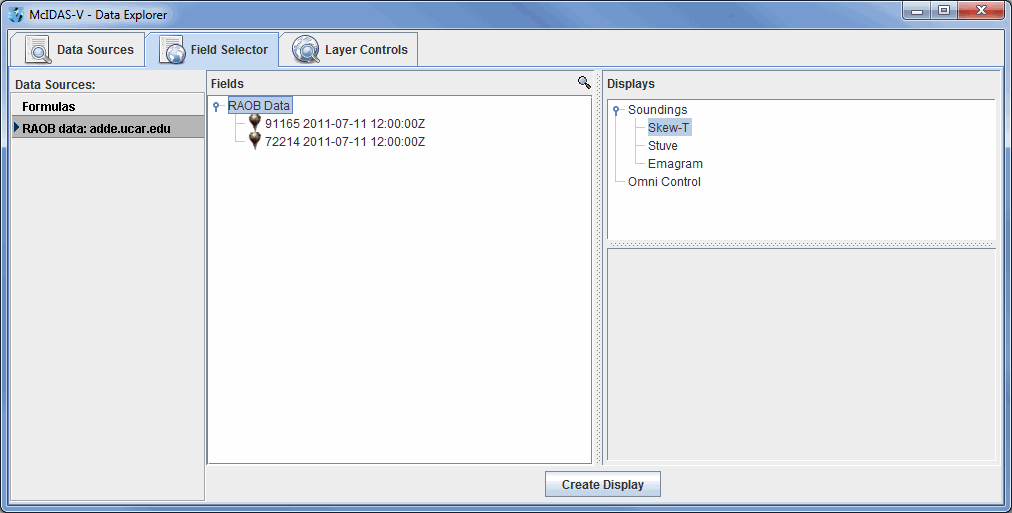
The RAOB data will be shown in the Field Selector tab.

Select "RAOB data" in the Fields panel and "Skew-T" or one
of the other sounding types in the Displays panel. All times will be loaded by selecting the RAOB Data field. You can select individual times to display at once by selecting individual times under RAOB Data. Make the
sounding display by clicking on the ![]() button.
The sounding will be displayed in the Layer Controls tab.
For more information about the Skew-T and other aerological displays, see Sounding
Display Controls.
button.
The sounding will be displayed in the Layer Controls tab.
For more information about the Skew-T and other aerological displays, see Sounding
Display Controls.
For more help with displaying RAOB sounding data, please see the Point Observations tutorial on the McIDAS-V Documentation webpage.