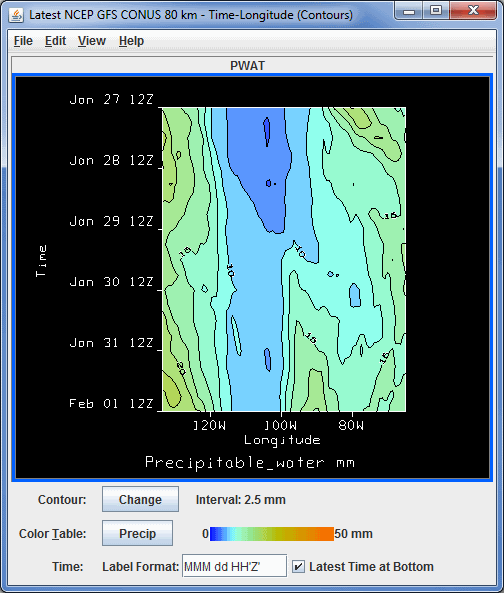
The Hovmoller display plots grid and gridded point data in a diagram with the Latitude/Longitude component on the X-axis, and the time component on the Y-axis. This display option is found in the Displays menu of the Field Selector tab of the Data Explorer. You can display the data as Time with respect to either Latitude or Longitude, and either as a Color Shaded or Contour view.

Image 1: Hovmoller Display
- Contour - Opens the Contour Properties Editor, which allows you to change the contour interval, style, and labeling of the contour lines. The current contour interval for the display is listed next to Interval. This is an option for Contour displays.
- Color Table - Shows the active color table and the associated high and low data values in the units of the display. As the mouse pointer is moved over the color bar, the value at a particular color is shown. Right click on the color bar or click on the button that displays the name of the Color Table to make modifications to the color bar. This allows you to open the Color Table Editor, change the range, select other color tables, etc.
- Time - Represents the format used to label time along the Y-axis. See the Formats and Data Preferences page for information on how to format the label. After you enter your desired values into this field, press Enter for it to be applied to the display.
- Latest Time at Bottom - When selected, the earliest date will be listed at the top of display, and the latest date will be listed at the bottom. This is the default for the Hovmoller display. If you uncheck this box, the Y-axis will be inverted, showing the latest date at the top, and the earliest date at the bottom.
By default, if you select a Longitude display, the entire spatial domain will be utilized, and the longitude range will go from the western extent to the eastern extent of your domain. The latitude will be averaged from the northern to southern boundaries of your domain. You can restrict the latitude and longitude domain by selecting a region in the Region tab of the Field Selector tab of the Data Explorer. The Latitude displays work the same way, by averaging the longitude across the entire domain unless you subset a region.
Many of the menu items seen utilizing this display are standard options that can be found in the Menus section of the Layer Controls page. However, there are a couple of options unique to this display.
The Edit menu has this unique option:
- Contour Line Color - Allows you to change the contour line color in the display. This option is available if you select a Contour display.
The View menu has this unique option:
- Hovmoller View - Allows you to capture an image of the data and change many aesthetic aspects of the display.