McIDAS-X Learning Guide
Version 2020
[Search Manual]
[Table of Contents]
[Go
to Previous]
[Go
to Next]
Enhancements - Changing Grayscale Contrast
In this section, you will use two methods to create a grayscale contrast. First,
you will create image contrast stretching and then you will create and apply
image data stretching.
In this exercise, you will use the EB command
to change the grayscale contrast of an image. First, you will use the mouse to
move the cursor over the image and stretch the grayscale contrast. Then, you
will input the values manually.
- Display the first GOES-16 visible image of Hurrican Dorian
on frame 1 centered on 28° N and 79° W, and add a gray scale bar.
- Type: IMGDISP DORIAN/M1.1 1 LATLON=28 79 GRAY=YES
- Initiate mouse-controlled grayscale stretching.
- Type: EB
- Move the cursor to the image window.
- Move the mouse to the right to brighten the image. The range
of pixels with a brightness near 255 (white) increases, as shown in the gray
scale bar at the bottom of the frame.
- Move the cursor towards the top of the frame to decrease
the image brightness. The range of pixels with a brightness near 0 (black)
increases, as shown in the gray scale bar at the bottom of the frame.
- Find an enhancement that you like and press the right mouse
button to end the enhancement.
- Save the grayscale enhancement as GRAY.
- Type: EU SAVE GRAY
- List the brightness value at the center of the image.
- Type: PC C
- Press: Alt D
- Restore the original grayscale of the image.
- Type: EU REST
- List the brightness value at the center of the image.
- Type: PC C
- Press: Alt D
Note the values are the same as those in step 8. IMGPROBE (Alt-D) does not
list the values that were modified with image contrast stretching, but lists
the values stored in the area.
Now, you will manually input the brightness values with the EB command.
- To get a stretch of the brighter values of the hurricane, find a pair of BRIT values to stretch between.
Position the cursor at TV coordinates (268,364) and (389,319) to find the brightness values.
- Type: PC T 268 364;IMGPROBE MODE=N
- Type: PC T 389 319;IMGPROBE MODE=N
The brightness values are 245 and 194.
- Rescale the brightness values 194 to 245 to go from 0 to
255. Brightness value 194 will become 0 and value 245 will become 255. All
values in between will be linearly stretched between 0 and 255.
- Type: EB 194 245 0 255
Since most of the brightness values of the hurricane are between 194 and 245,
creating an enhancement
for this range makes the image features more prominent. Note that all brightness
values outside the range of 194 to 245 remain unchanged.
- Save the enhancement as GRAY2.
- Type: EU SAVE GRAY2
- Restore the default enhancement table to the frame.
- Type: EU REST
- List the enhancement tables that start with GRAY on your
workstation.
- Type: EU LIST GRAY
 PERM      SIZE LAST CHANGED FILENAME DIRECTORY
 ---- --------- ------------ -------- ---------
 -rw-      3268 Oct 29 17:01 GRAY.ET  /home/user/mcidas/data
 -rw-      3268 Oct 29 17:01 GRAY2.ET /home/user/mcidas/data
 6536 bytes in 2 files
|
- Delete the saved enhancement tables.
- Type: EU DEL GRAY;EU DEL GRAY2
Next, you will define stretch tables to stretch brightness and temperature values
stored in an area. Then, you will apply the stretch tables to images and compare
the stretched values to the original values.
- Display a local GOES-16 0.5km Visible image on frame 1 centered
on New Orleans. Decrease the resolution by a factor of 8 and add a high resolution
map.
- Type: IMGDISP ABI/CONUS 1 STA=KNEW MAG=-8 BAND=2;
MAP H
- Position the cursor at the center of the frame and list
the brightness value.
- Type: PC C
- Press: Alt D
The brightness value at the center is 67.
- Next, initialize a stretch table named LEARN to stretch
brightness values. The VISR parameter specifies the data type as GOES 1-byte
data.
- Type: SU INI LEARN VISR BRIT
- Define the brightness ranges to stretch. Assign the brightness
value 0 to 255 and the value 255 to 0 to make light areas dark and dark areas
light.
- Type: SU MAKE LEARN 0 255 255 0
- List the breakpoints in the stretch table.
- Type: SU TABLE LEARN
The table lists the brightness values and the corresponding stretched values
as shown below.
 SU TABLE LEARN
 BREAKPOINTS STORED IN TABLE : LEARN.ST
 INPUT       OUTPUT
 -----       ------
  0             255
  255           0
 CALIBRATION TYPE  : VISR
 CALIBRATION UNITS : BRIT
 BAND NUMBER       : -1
 INTERPOLATION TYPE: LIN
 SU: DONE
|
- Display a local GOES-16 0.5km Visible image on frame 2 centered
on New Orleans. Decrease the resolution by a factor of 8, apply the stretch
table LEARN, and add a high resolution map.
- Type: IMGDISP ABI/CONUS 2 STA=KNEW MAG=-8
BAND=2 SU=LEARN SF=YES;MAP H
- Set the loop bounds from 1 to 2 and compare the images.
- Type: LS 1-2
- Press: Alt A
- Press: Alt B
- Show frame 2 and list the areas values at the cursor's center.
- Type: SF 2;PC C;IMGPROBE MODE=N
Notice that there is a MODB/LEARN data type listed in the output of the D
command, as shown below. This lists the value of the stretched data.
     Image Name           Day      Nominal Time   Scan Time    Band
  ----------------      -------    ------------   ---------    ----
  ABI/CONUS.1          4 Jan 18004   16:57:20      16:58:24       2

                        File     Nominal  Image     RAW         RAD         ALB         BRIT        MODB
       Lat/Lon      Line/Element  Line/Element                   *          %                       LEARN
 30:03:14/ 90:02:11   3015/ 4470    3016/ 4471            362      37.121        6.91          67         188
 *   watts/meter**2/steradian/micron
|
Since the values in the table are reversed (0 is now 255
and 255 is now 0), you can calculate the stretched value of a pixel by
subtracting the pixel's original brightness value from the maximum value.
For example, to calculate the stretched value of the center pixel, subtract
the original brightness value (67) from the maximum brightness value (255);
the stretched value of the center pixel is 188 (255-67).
- List the stretch tables on the workstation.
- Type: SU LIST
Next, you will create a Multiple Breakpoint (MB) stretch table
to enhance clouds in a GOES infrared image and create an approximate MB stretch
curve.
- Erase the graphics on frames 1 and 2. Display the second most recent
GOES-16 2km IR image on frame 1 centered on Washington, DC, reduce the
resolution by 2 and show the frame.
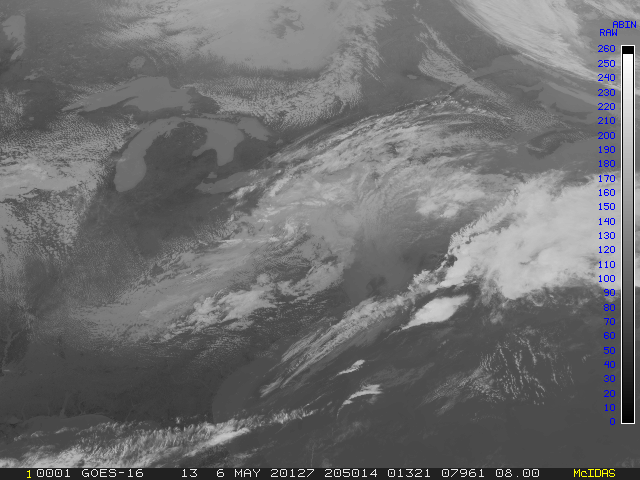
Use the REFRESH keyword of IMGDISP to
draw a data bar on the image and label every 10th value in blue (color 6).
- Type: ERASE G 1 2;IMGDISP G16FD.-1 1
STA=KDCA MAG=-2 BAND=13 SF=YES REFRESH='BAR (GRA) LINT=10 COLOR=6'
- Initialize a stretch table named MB to stretch temperature
values to a brightness range. The X parameter uses a default for any type of data.
- Type: SU INI MB X TEMP
- Assign the temperature values between 330° K and 302° K
to the brightness value 0 in the MB stretch table.
- Type: SU MAKE MB 330 302 0 0
- Assign the temperature values between 301.9° K and 279.9° K
to the brightness range 0 to 102 in the MB stretch table.
- Type: SU MAKE MB 301.9 279.9 0 102
- Assign the temperature values between 279.8° K and 241.4° K
to the brightness range 102 to 167 in the MB stretch table.
- Type: SU MAKE MB 279.8 241.4 102
167
- Assign the temperature values between 241.3° K and 230.4° K
to the brightness value 117 in the MB stretch table.
- Type: SU MAKE MB 241.3 230.4 117
117
- Assign the temperature values between 230.3° K and 219.4° K
to the brightness value 156 in the MB stretch table.
- Type: SU MAKE MB 230.3 219.4 156
156
- Assign the temperature values between 219.3° K and 213.4° K
to the brightness value 75 in the MB stretch table.
- Type: SU MAKE MB 219.3 213.4 75 75
- Assign the temperature values between 213.3° K and 209.4° K
to the brightness value 10 in the MB stretch table.
- Type: SU MAKE MB 213.3 209.4 10 10
- Assign the temperature values between 209.3° K and 192.4° K
to the brightness range 10 to 250 in the MB stretch table.
- Type: SU MAKE MB 209.3 192.4 10 250
- Assign the temperature values between 192.3° K and 162.8° K
to the brightness value 250 in the MB stretch table.
- Type: SU MAKE MB 192.3 162.8 250
250
- Verify that the stretch table contains the correct breakpoints.
- Type: SU TABLE MB
The table MB is listed as shown below.
 SU TABLE MB
 BREAKPOINTS STORED IN TABLE : MB.ST
 INPUT       OUTPUT
 -----       ------
  162.8         250
  192.3         250
  192.4         250
  209.3         10
  209.4         10
  213.3         10
  213.4         75
  219.3         75
  219.4         156
  230.3         156
  230.4         117
  241.3         117
  241.4         167
  279.8         102
  279.9         102
  301.9         0
  302           0
  330           0
 CALIBRATION TYPE  :
 CALIBRATION UNITS : TEMP
 BAND NUMBER       : -1
 INTERPOLATION TYPE: LIN
|
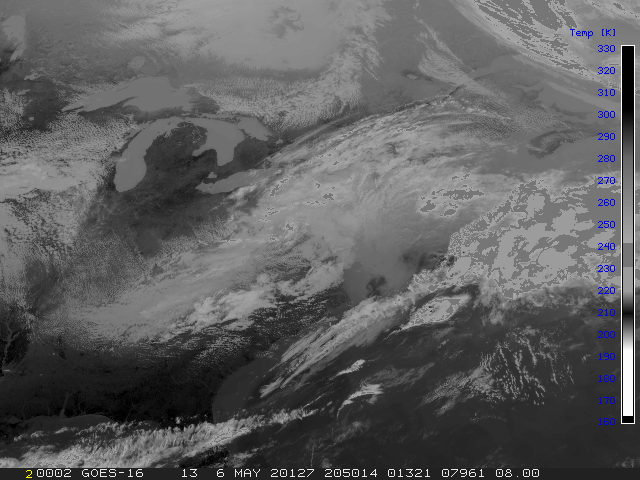
- Display the second most recent GOES-16 2km IR image on frame 2 centered
on Washington, DC, reduce the resolution by 2
and apply the stretch table MB. Draw a data bar on the
image using a label interval of 10. Set the loop bounds from 1 to 2.
- Type: IMGDISP G16FD.-1 2 STA=KDCA MAG=-2 BAND=13
SU=MB SF=YES REFRESH='BAR (GRA) LINT=10 COLOR=6';LS 1-2
- Compare the two images, one without a stretch table applied
and the one with, as shown below.
- Press: Alt B
- Press: Alt A
Original image:

Data stretched image:

- List the stretch tables on your workstation.
- Type: SU LIST
 PERM      SIZE LAST CHANGED FILENAME    DIRECTORY
 ---- --------- ------------ ----------- ---------
 -rw-      1604 Oct 30 08:31 LEARN.ST    /home/user/mcidas/data
 -rw-      1604 Oct 29 15:36 MB.ST       /home/user/mcidas/data
3208 bytes in 2 files |
- Exit McIDAS
- Type: EXIT
[Search Manual]
[Table of Contents]
[Go
to Previous]
[Go
to Next]