Leads Detection using AI
The full description of the AI based sea ice leads detection algorithm can be found in Application of a Convolutional Neural Network for the Detection of Sea Ice Leads and A 20-Year Climatology of Sea Ice Leads Detected in Infrared Satellite Imagery Using a Convolutional Neural Network.
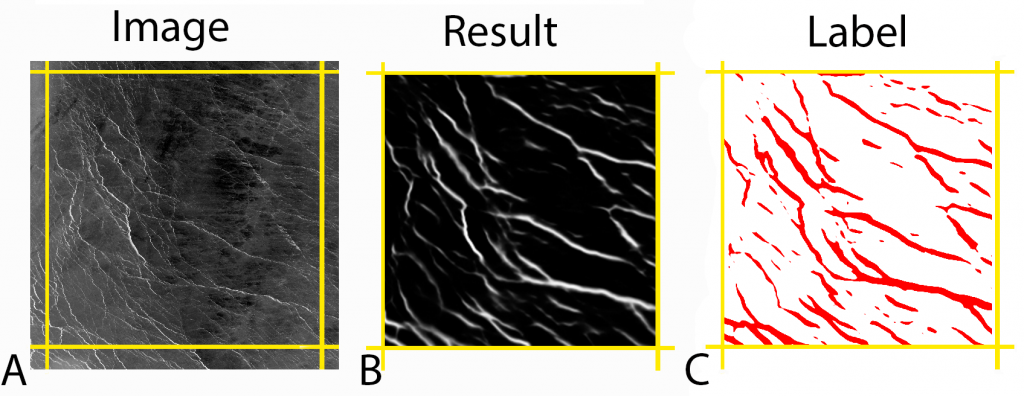
Below, a small 512 km × 512 km sample of the VIIRS 11 μm brightness temperature image from 0024 UTC on 1 January 2020 (warm features are bright) in panel (A). The corresponding U-Net greyscale image of segmentation results in panel (B). Where the segmentation results are above the detection threshold, the binary lead labels are shown in red in panel (C).
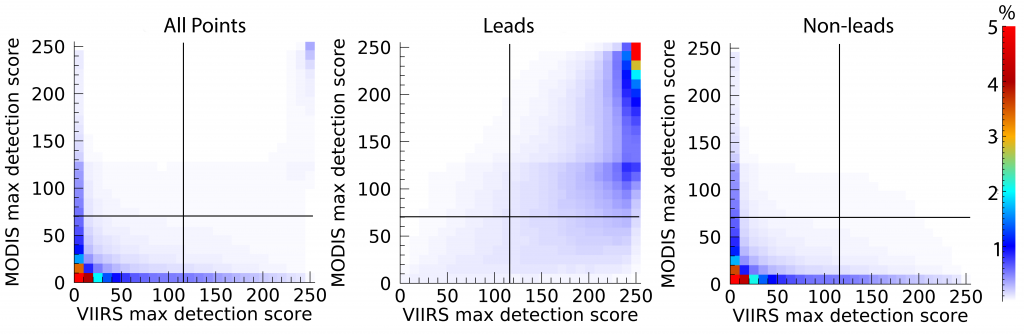
Below, the relative frequency of detection score for all points (A), for leads in the validation mask (B), and for non-lead locations (C) in the validation masks. This is for the aggregate of 1 January 2020, 1 February 2020, 1 March 2020, and 1 April 2020. The detection thresholds are shown as black lines at 45 for VIIRS and 32 for MODIS.
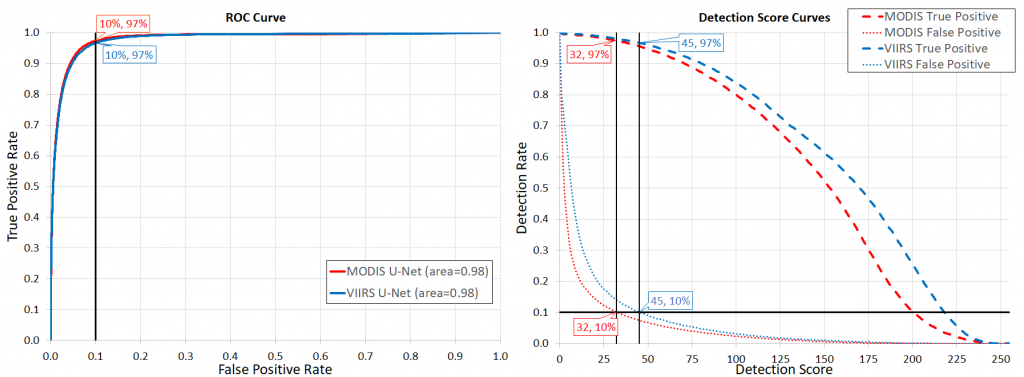
Below n the left, the receiver operating characteristic (ROC) curve for MODIS (red) and VIIRS (blue) shows the detection threshold at the intersection of the 10% false positive rate (with a true positive rate of 97% for VIIRS and MODIS) is selected as the detection threshold. On the right, the same true positive and false positives curves are shown, but this time as a function of detection score.
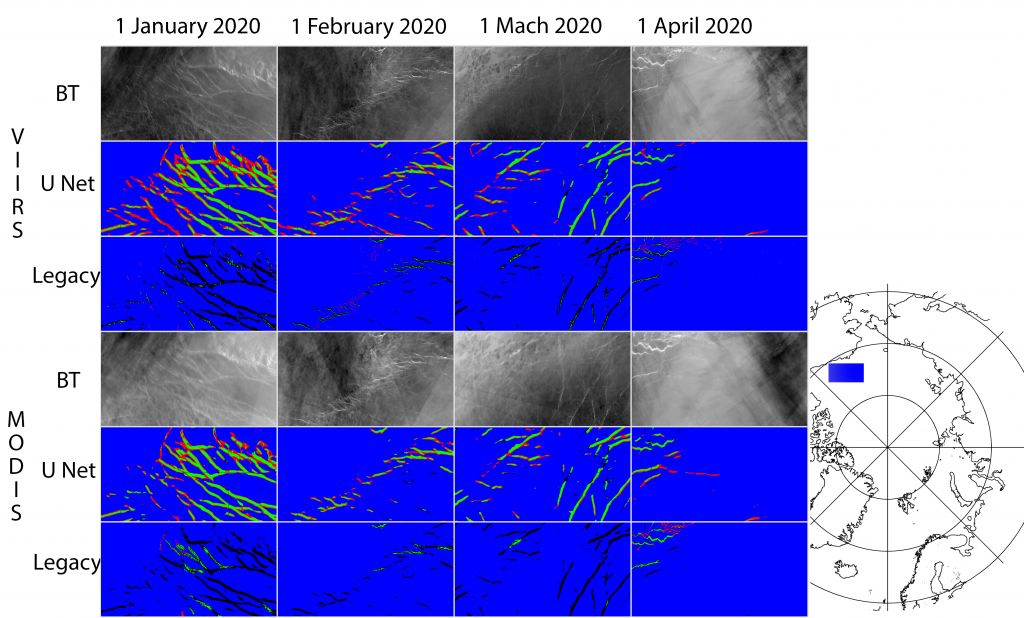
Below, the VIIRS (top) and MODIS (bottom) 11 μm composite brightness temperature imagery and leads product results from (left to right) 1 January 2020, 1 February 2020, 1 March 2020, and 1 April 2020. Blue is true negative, green is true positive, red is false positive, and black is false negative in comparison with the validation mask.