« Back to "Typhoon Kammuri - November 28 - December 2 2019"
Typhoon Kammuri on 29 November 2019
Posted: November 29, 2019
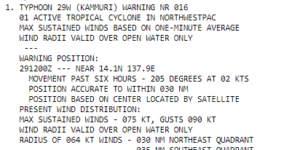
On 29 November 2019, Kammuri had not really strengthened over the last 24 hours. As of the 1500Z Joint Typhoon Warning Center (JTWC) discussion, Typhoon Kammuri had winds of 75knts, or ~86mph. This would make it a Category 1 storm in the Atlantic basin.
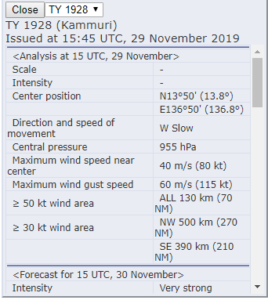
The Regional Specialized Meteorological Center (RSMC) Tokyo stated that the maximum winds at the center were 80knts or ~92mph.. While slightly different than the speed the JTWC showed, this difference is due to differing methods of determining the winds and due to the fact that JTWC adopts a 1 min mean wind speed, but RSMC Tokyo adopts 10 mins mean wind speed. If one used the JMA wind speed for your tropical system classification, Kammuri would be considered the equivalent of a Category 1 storm in the Atlantic basin.
As previously mentioned, while this doesn’t affect forecasts for this storm, this sort of difference in measurement could mean the difference between a tropical storm warning or a hurricane warning depending on the location you are using for your forecasts.
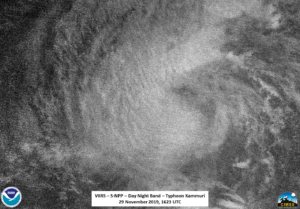
S-NPP first saw Typhoon Kammuri at ~1622Z and was a near nadir pass for the satellite. This meant that VIIRS had a nearly perfect viewing straight into the storm. The I05 (11μm) imagery continued to show a large central dense overcast (CDO) that would obscure the low-level circulation. Several prominent features in the CDO include tropospheric gravity waves along with multiple overshooting tops. This is a possible indicator of “flaring” convection and an indicator of active convection.
The waxing crescent (10% illumination) meant that the clouds in the Day Night Band (DNB) were solely illuminated by airglow. The active convection was enough to excite convectively generated mesospheric gravity waves, which in this case are a sign of intense energy being transmitted through the troposphere all the way up ~75km in the atmosphere. Other prominent features in the DNB imagery including some of the shelf clouds, which are in the troposphere, coming from the CDO.
These are of course a little more obvious if you tweak the enhancement just slightly
Since S-NPP was near nadir, it also meant that the ATMS instrument also was able to observe the storm near nadir. If you compare the 88.2GHz imagery, as compared to the I05 (11μm) brightness temperature, you could see that the circulation was becoming a bit more obvious and perhaps trying to form a closed circulation, not just in the I05 (11μm) but the microwave as well. However, it was still to the side of the CDO
It is also of particular note that the circulation 31.4GHz, which sees a different level of the atmosphere than the 88.2GHz, was wider and almost completely the CDO
In addition, it was offset to the east of the, tighter, circulation in the 88.2GHz channel
NOAA-20 observed Kammuri on the eastern side of the pass, owing to the orbit and movement of the storm, at approximately 1714UTC. Like S-NPP, it also observed mesospheric gravity waves in the DNB. With the extended granule in the DNB imagery, more features between the two passes could be compared, though at degraded resolution in the extended granule region, as seen below
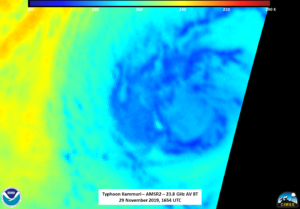
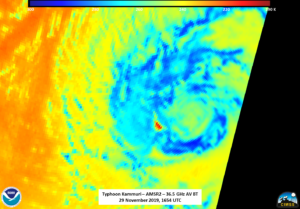
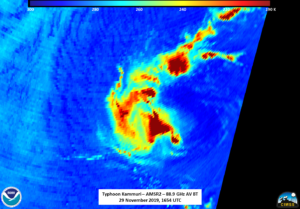
In between S-NPP and NOAA-20, the AMSR2 instrument on GCOM-W1 was able to observe Kammuri again at approximately 1654UTC on the eastern side of the pass. Even with the parallax (curvature) effects due to it being on the edge of the scan, one can still get an idea of the structure of the storm. While the 89.0GHz seems to indicate a fairly tight rotation, both the 36.5 and 23.8GHz brightness temperatures seem to indicate a more broad circulation offset from the 89.0 GHz center of rotation.
These are important observations as the differences in the mid-levels and low-levels can help indicate shear within a storm. One might wonder if this shift may be due being on the edge of the scan. However, recall the 31.4GHz ATMS brightness temperature from S-NPP, taken near nadir, also indicated a wider rotation in the 31.4GHz circulation than the 88.2GHz brightness temperature, as well as a similar shift. This consistency between the two sensor observations, taken roughly 30 minutes apart would suggest that the shear was present for both observations.
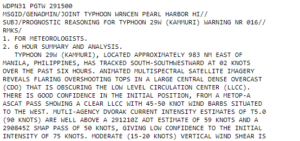
The observations of the low-level circulation being under the CDO are also consistent with the Joint Typhoon Warning Center (JTWC) prognostic reasoning, which allows us to understand the reasoning for the forecasts issued. In the case of the 15UTC prognostic reasoning, this time they did not use microwave imagery, but Advanced Scatterometer (ASCAT) winds on MetOp-A. These winds that utilize measurements from the scatterometer instrument on the MetOp series of satellites, which provide the speed and direction of winds over the surface of the oceans.
In addition, the 21UTC prognostic reasoning also mentioned the use of the AMSR-2 microwave imagery as well as the assymetric infrared signature:
ANIMATED ENHANCED INFRARED SATELLITE IMAGERY REVEALS
AN ASYMMETRIC CENTRAL DENSE OVERCAST (CDO) OBSCURING THE LOW LEVEL
CIRCULATION CENTER (LLCC). THERE IS FAIR CONFIDENCE IN THE INITIAL
POSITION BASED ON A MICROWAVE EYE FEATURE REVEALING A BROAD LLCC IN
291652Z AMSR-2 AND 291826Z GMI 37GHZ MICROWAVE IMAGES.
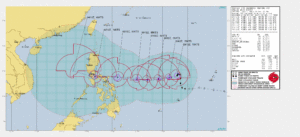
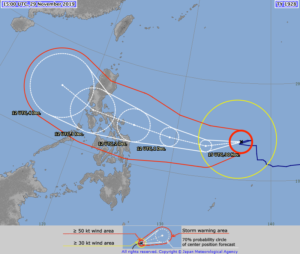
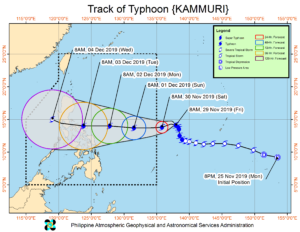
The forecast from JTWC and JMA has Kammuri continuing to slightly intensify through Sunday, 1 December 2019, and impacting the Philippines by Tuesday, 3 December 2019.
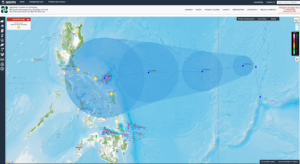
The Philippine Atmospheric, Geophysical and Astronomical Services Administration (PAGASA) continue to track Kammuri in order to assess the impacts on the various islands in the path of the storm, with their forecast being similar to JTWC and JMA
In anticipation of the storm, PAGASA has continued to issue flood alerts to various locations. This is especially important due to the fact most of the population is along the coast and in low-lying areas.

