« Back to "Typhoon Kammuri - November 28 - December 2 2019"
Typhoon Kammuri on 28 November 2019
Posted: November 28, 2019
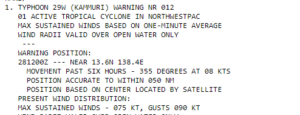
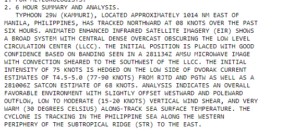
On 28 November 2019, tropical depression 29W strengthened into Kammuri intensified into a typhoon. The 1500Z, the Joint Typhoon Warning Center (JTWC) stated that Typhoon Kammuri had strengthened, having winds of 75knts, or ~86mph. This would make it a Category 1 storm in the Atlantic basin.
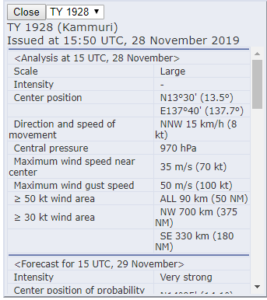
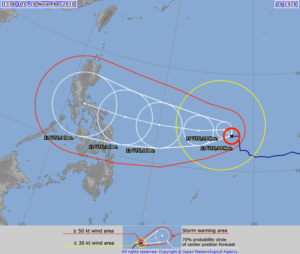
The Regional Specialized Meteorological Center (RSMC) Tokyo stated that the maximum winds at the center were 70knts or ~80mph. While slightly different than the speed the JTWC showed, this difference is due to differing methods of determining the winds and due to the fact that JTWC adopts a 1 min mean wind speed, but RSMC Tokyo adopts 10 mins mean wind speed. As with the JTWC discussion, it would make Kammuri a Category 1 storm in the Atlantic basin.
As previously mentioned, while this doesn’t affect forecasts for this storm, this sort of difference in measurement could mean the difference between a tropical storm warning or a high wind warning
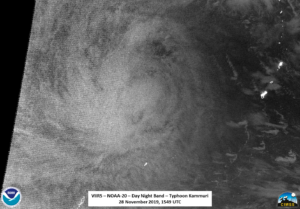
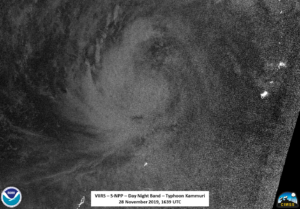
NOAA-20 first saw Typhoon Kammuri at ~1552Z, on the western side of the scene. The waxing crescent (4% illumination) meant that the clouds were solely illuminated by airglow.
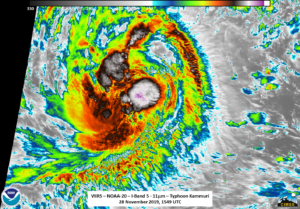
The I05 (11μm) imagery was more telling, showing what is termed a “central dense overcast” (CDO) over the area of circulation. The CDO is useful in determining the center of circulation and intensity of tropical storms. However, s one can see in the I05 (11μm) imagery from NOAA-20, this is a problem for systems where the circulation is obscured.
This is one reason that microwave imagery is so important. While the ATMS instrument is collocated on NOAA-20 and S-NPP, the 88.2GHz imagery is not a high-resolution sounder, it does help approximate the level and location of the circulation. If you compare the ATMS 88.2GHz imagery to the IR imagery, it appears to be shifted slightly to the southwest of the densest convection
This might suggest that there is some sheering to the storm at that particular time. One can then utilize the second satellite in the JPSS system, S-NPP, which in this case was a half orbit (roughly 50 minutes) ahead of NOAA-20. As such, S-NPP observed Kammuri on the eastern side of nadir at ~1642Z, roughly Again, because the only illumination was from airglow meant that only the general features of the storm could be seen in the Day Night Band (DNB) imagery. Also because of differences between the implementation of the DNB on the two satellites, the DNB imagery is also a bit noisier on S-NPP than on NOAA-20.
Even so, the structure of the storm can still be seen. Similar to the imagery from NOAA-20, the circulation was obscured by the CDO. However, there is a noticeable increase in the size of the CDO, perhaps an indication of some strengthening of the storm.
The ATMS 88.2GhZ imagery again showed that the rough location of the circulation center was still slightly offset from the center of the CDO, but perhaps moving closer to being in roughly the same location.
Collocated observations of the location of the CDO and microwave imagery are important to help measure the intensity of a tropical cyclone, by seeing how far the center of circulation is within the storm and the temperature difference in the cloud tops in the CDO. Since microwave imagers can see “into the cloud”, this helps in determining the location of the tropical system. However, one does need to utilize high spatial microwave sensors as well to help determine how the circulation is within a storm. Fortunately, the AMSR2 instrument on GCOM-W1 observed Kammuri at approximately 1612UTC. One can get a better idea of how the storm is structured by comparing the 89.0GHz to the 23.8GHz brightness temperatures. As seen below, the center of circulation is fairly close to being at the exact same place between the two channels, indicating that perhaps the storm is becoming more organized.
However, an important thing to note is that the circulation in the 89.0GHz channel is not completely surrounded by the convection. This is also something that can be seen in the VIIRS and ATMS imagery from NOAA-20 and S-NPP. These observations are all consistent with the Joint Typhoon Warning Center (JTWC) prognostic reasoning, which allows us to understand the reasoning for the forecasts issued. In the case of the 15UTC prognostic reasoning, part of their analysis shows the utilization of microwave imagery, in this case, AMSU possibly on MetOp-C based on the timestamp of the pass used, to perform their analysis.
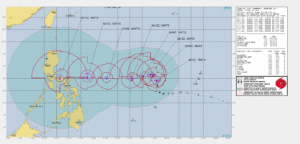
The forecast from JTWC has Kammuri intensifying to ~125knts by 1 December 2019, which would be the equivalent to a Category 4 storm in the Atlantic. Both JTWC and JMA have it impacting the Philippines by 3 December 2019.
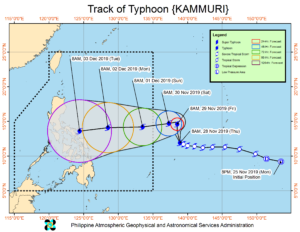
Because of the impacts to the Philippines, the Philippine Atmospheric, Geophysical and Astronomical Services Administration (PAGASA) are also tracking Kammuri to assess the impacts on the various islands in the path of the storm. Their track is also very similar to JTWC and JMA
In anticipation of the storm, PAGASA has begun to issue flood alerts to various locations. This is especially important due to the fact most of the population is along the coast and in low-lying areas.
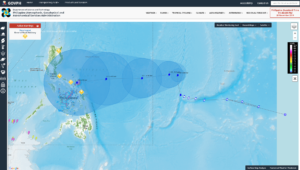
Image from PAGASA website on 28 November 2019 at 1541Z
PAGASA stated in a press conference earlier today, that appropriate measures and linkage with the 2019 Southeast Asian Games organizers have been in place in preparation for the typhoon. This includes such as storm chasers and mobile radars being dispatched to competition venues in Metro Manila and Central Luzon to provide support.

