« Back to "Hurricane Storm Dorian Aug 28 - Sep 6 2019"
Usage of NUCAPS in hurricane forecasting.
Posted: September 4, 2019
As mentioned in a previous post, forecasters at the National Hurricane Center rely on aircraft to drop radiosondes (aptly named a dropsonde) to provide information information about the surrounding environment of the storm. Because dropsondes cost money and you can’t fly an aircraft all over the place, the location of the dropsonds are specifically chosen to provide the information in the vital locations. Even with special balloon launches over land, these are at fixed locations limited to Weather Forecast Offices. In addition, aircraft also have a limited range, meaning that some tropical systems in the extreme eastern part of the Atlantic, or the middle of the Pacific or even near Asia do not have aircraft that can fly in and provide dropsonde information
Fortunately, the NOAA Unique Combined Atmospheric Processing System (NUCAPS) was developed to help fill this gap. Initially NUCAPS was developed to use data from the Cross-track Infrared Sounder (CrIS) and Advanced Technology Microwave Sounder (ATMS) currently onboard the Joint Polar Satellite System satellites. In 2006, NUCAPS was implemented at NOAA as the NASA AIRS Science Team version 5.9 algorithm to generate operational sounding products from MetOp-A IASI/AMSU radiance measurements. NUCAPS has since been adapted for CrIS/ATMS on Suomi-NPP (2012 to present) and NOAA-20 (2017 to present) as well as follow-on MetOp-B and -C satellites.
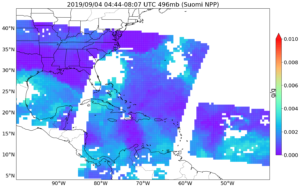
In addition to the soundings, NUCAPS also produces information of trace gases, including water vapor mixing ratio. These trace gases can be displayed at various pressure levels to give forecasters an idea of the surrounding environment in regions were sounding data might not be readily available.
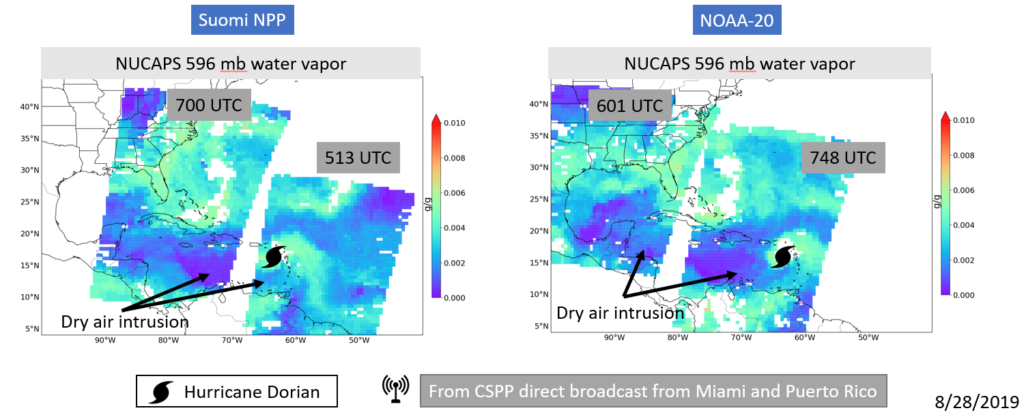
In the case of tropical cyclones, NUCAPS can be useful for sampling moisture in the tropical cyclone environment. By utilizing data from direct broadcast antennas means that data can be recieved, processed and analyzed in a manner in which it can be used by forecasters. Below is an example from 28 August 2019 from then Tropical Storm Dorian, where NUCAPS data derived from direct broadcast antennas in Miami and in Puerto Rico.
Image courtesy of Rebekah Esmaili and Nadia Smith, STC
 As can be seen in the above images, one can see drier (purple) air being entrained into Hurricane Dorian. While forecasters were using radar imagery to observe the storm at the time, the pronounced dry slot was mentioned in the 11am AST (15 UTC) forecast discussion from the previous day as well as the 5pm AST (21UTC) forecast discussion. Unfortunately, the dry air did not impede the development of Dorian into a hurricane, which occurred at 1800UTC on 28 August 2019.
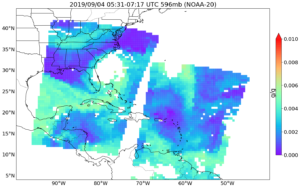
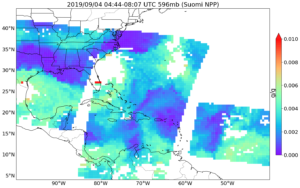
As mentioned in the post from 2 September, a dry slot was evident in the IR imagery from NOAA-20 and NPP. This dry air being wrapped in on the eastern side is somewhat evident in the H2O mixing ratio at mid-levels in the NUCAPS products.
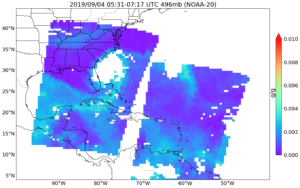
But it even more evident higher up in the atmosphere
This also shows the need to utilize data from two or more satellites, because the combined coverage of both fills in the gaps between successive passes.

