« Back to "Hurricane Storm Dorian Aug 28 - Sep 6 2019"
Tropical Storm Dorian from 28 August
Posted: August 28, 2019
This morning has seen Dorian strengthen to having 60mph winds as of the 1200 UTC public advisory on 28 August 2019. This has not changed since the 0600Z advisory on 28 August 2019.
NPP, GCOM-W1 and NOAA-20 all passed over Dorian prior to the 0600Z advisory, each observing unique features. This discussion will step through the VIIRS imagery first and then move on to the microwave instruments (ATMS and AMSR2).
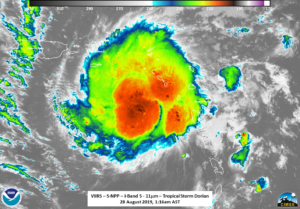
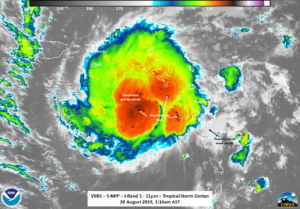
At ~0516 UTC (1:16 am AST), SNPP caught Dorian on the west side of the scan. While this meant that parallax was present, one could clearly see convection building both over the Caribbean as well as over the Leeward islands.
While there is a somewhat circular shape to the convection of Dorian, a real “center” is not readily visible, though multiple overshooting tops and convective gravity waves can be easily seen. It is also worth nothing the wave clouds coming off Guadeloupe.
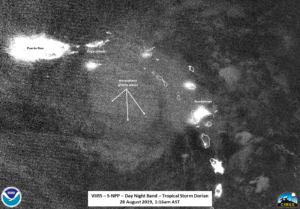
The waning crescent moon (6% illumination) meant that the primary source of illumination was either from anthropocentric sources(contained to the islands) or from airglow. The DNB imagery from S-NPP did appear to exhibit some mesospheric gravity waves. However, they are not easily identifiable due to Dorian being on the edge of the scan for S-NPP.
Roughly 50 minutes later at ~0606UTC (2:06am AST), NOAA-20 had a close to nadir pass. It is interesting to see how the high resolution IR (I05) imagery drastically changed between the two passes.
The circular shape of the storm is not as present and the convection over the Caribbean is not as intense. In both cases, from the IR imagery alone and how the circulation looks, one might be tempted to place the center of circulation just to the southwest of St Kitts (the island that kinda looks like a drumstick). The other prominent feature from the storm that can be seen in the DNB are….mesospheric gravity waves. As has been pointed out previously, these are typically a sign of a lot of energy being released, as energy has to be transferred from the troposphere all the way through the stratosphere and to the mesosphere.
As was mentioned above, the IR imagery, even from GOES-16, can possibly not show the center of circulation in the right place. In order to get a better idea of where the circulation is located, NHC and others rely on information from aircraft (in the Atlantic basin) as well as microwave imagery from a variety of sensors. In addition, these sensors are utilized in NWP models to help improve forecasts. The ATMS instrument on NOAA-20 doesn’t really show a true circulation center. However, both the ATMS 88.2GHz BT and MiRS rain rate gives a better idea of where circulation center is located.
In addition, a timely nadir overpass of Dorian at 0553UTC (1:53am AST) from the AMSR2 instrument on GCOM-W1 showed exactly where the center of location was located, namely on the northwest side of the larger area of convection.
This would support the NHC forecast discussion at 0900Z on 28 August, where it states “The Hurricane Hunters also reported that Dorian has developed a partial eyewall”, which is something that can be seen in the AMSR2 imagery. In addition, the compact and asymmetric nature of the Dorian can be seen.
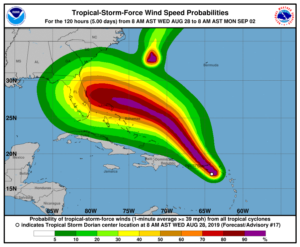
The current forecast has it impacting the US Virgin Islands today, with it possibly intensifying into a major hurricane on Sunday (1 September 2019 before potentially impacting the United States.
Warning cone and wind forecast taken from NHC Graphics page for Tropical Storm Dorian on 28 August 2019 at 11am CDT
FEMA and other stakeholders are currently monitoring the situation for impacts to Puerto Rico and the United States.


