« Back to "Hurricane Storm Dorian Aug 28 - Sep 6 2019"
Hurricane Dorian from 6 September
Posted: September 6, 2019
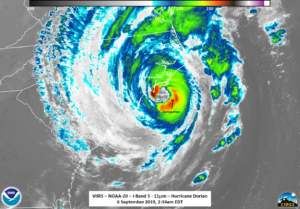
Hurricane Dorian weakened to a category 1 storm overnight, and has just made landfall on Cape Hatteras this morning, according to the National Hurricane Center with the latest advisory stating it had sustained winds of 90mph as it begins to pull away from the United States. This is similar to how Dorian was at 0600 and 0700 UTC, with the pressure steadily rising as it brushed the North Carolina coast. Because of the location of Dorian, the power outages (~220K customers in North Carolina, ~144K customers in South Carolina, according to poweroutages.us ) along the coastline could not easily be seen due to cloud cover. Note that the number of outages will vary over the next day as crews are able to affect repairs or wind damages new lines.
NOAA-20, GCOM-1 and S-NPP all passed over Dorian all within the span of roughly 50 minutes, spanning the 0700UTC public advisory, each observing unique features as it was pulled away from the United States. As with previous discussions of Dorian, this discussion will step through the VIIRS imagery first and then move on to the microwave instruments (ATMS and AMSR2).
The first satellite to observe Dorian was NOAA-20 at 0634UTC on the west side of nadir. This allowed a good look at Dorian’s circulation, with the high resolution 11μm imagery showing dry air being pulled in to the circulation center, as well as some convection just off the North Carolina coast.
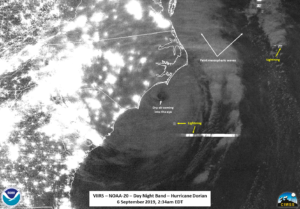
While the moon is at a first quarter moon with ~54% illumination, it was below the horizon for both the NOAA-20 and NPP passes, meaning that airglow continued to illuminate Dorian. It was unsurprising that one could see lightning streaks and the dry air slot near the eye.
In addition, some faint mesospheric gravity waves could also be seen on the northern side of the storm
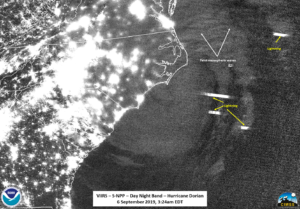
These features were also seen as S-NPP flew over Dorian, catching it on the eastern side of the scan at ~0724 UTC (3:24am EDT), though in the case of S-NPP, the eye became a little less broad in the IR imagery
Similar to the NOAA20 imagery, lightning and some faint mesospheric gravity waves could be seen in the Day Night Band.
While Dorian was on the edge of the scan for S-NPP, that didn’t prevent it from observing the storm with the ATMS instrument. Along with the ATMS imagery from NOAA-20, one could see the change in the circulation of the storm, particularly with the warmer (blue) air can be seen being pulled into the circulation of Dorian.
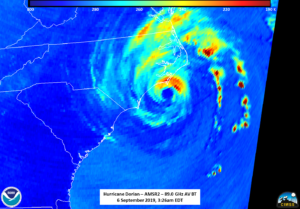
This somewhat more exposed circulation was also present in the AMSR2 imagery taken ~40 minutes after the NOAA-20 pass and about 3 minutes before the S-NPP pass at ~0726UTC (3:26am EDT).
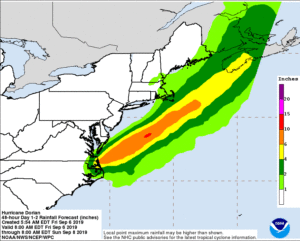
The main concern with this storm has been the potential heavy rain, storm surge and wind. While the IR imagery can give an idea of where rain is occurring, both the S-NPP and NOAA-20 MiRS rain rate products indicated that the main bulk of the heavy rain was along the eyewall, which can be seen brushing up against the coastline in the MiRS (slider shown below) and other imagery.
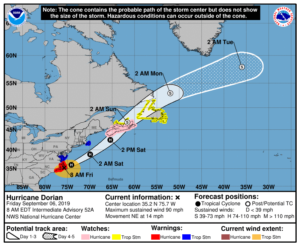
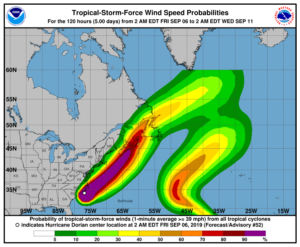
As mentioned in the latest forecast discussion at 1200UTC (https://www.nhc.noaa.gov/archive/2019/al05/al052019.discus.052.shtml?), Dorian is expected to continue to weaken due to an increase in wind shear as well as crossing into cooler waters. The current track has it headed over Nova Scotia in the next couple of days, eventually south of Greenland and out into the northern Atlantic.
Warning cone, precipitation and wind forecasts taken from NHC Graphics page for Hurricane Dorian on 6 September 2019 at 9:00am CDT
While monitoring will continue for any lingering outages and other impacts, this will be the last analysis of Dorian… until maybe it hits Canada. Meanwhile. And do watch the next system off the Cape Verde islands remains of interest for possible impacts in a couple weeks.

