« Back to "Hurricane Storm Dorian Aug 28 - Sep 6 2019"
Category 3 Hurricane Dorian from morning of 5 September
Posted: September 5, 2019
Hurricane Dorian strengthened to a category 3 storm last night with winds currently at 115 mph, according to the latest advisory. This is similar to how Dorian was at 0600 and 0700 UTC, though the pressure has risen just slightly.
Unfortunately, the GCOM-W1 pass was to either side of Dorian this morning, meaning it was not able to observe the inner structure until tomorrow morning. This means only NOAA-20 and NPP observe the storm from the satellites that are being discussed, though imagery from GOES-16 continues to provide high temporal information on changes occurring with Dorian.
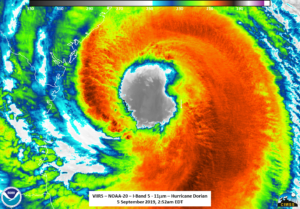
The first satellite to observe Dorian was NOAA-20 at 0652UTC close to nadir. The nearly the wide circulation being completely being surrounded by convection, though the interaction with land can clearly be seen on the western side of the storm. As can be seen in the IR imagery, the strong convection was primarily over the ocean.
Recall that Dorian is over the Gulf Stream, meaning the warm SSTs can help feed the storm. This wide eye is something that is noted by the 0900Z forecast discussion. This can also be seen in the zoomed in 11μm imagery.
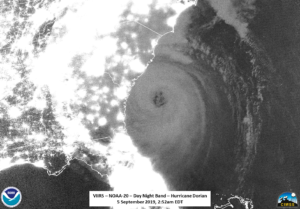
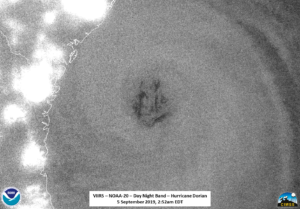
The DNB continues to be lit by either city lights (on the west side) or airglow. Recall the moon is at a waxing crescent moon (43% illumination). While there were no mesospheric gravity waves present, one could again clearly see mesovortices within the eye of the storm.
These can more easily be seen in the zoomed in imagery over Dorian
In addition to the fact that the Bahamas were clear in the NOAA-20 imagery, allowing for power outage analysis, discussed in this post, VIIRS imagery also showed that the most intense convection is still just offshore. This is supported by the ATMS microwave 88.2GHz BT imagery, one can easily see the circulation of the storm, with the convection easily being seen as colder temperatures and the warmer temperatures in the eye.
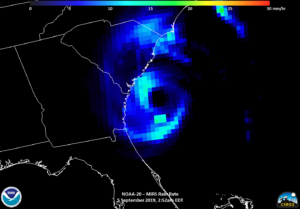
That being said, both the ATMS and MiRS rain rate product do not show cold clouds completely surrounding the circulation. Being able to see into the storm is important to determine the structure of the storms. Also, the MiRS rate also shows the most intense rain, at the time, being off the South Carolina coast.
S-NPP, which flew over Dorian ~50 minutes later at ~0742UTC on the eastern edge of the scan. This meant the eye and other features were shifted due to parallax in the IR and the DNB was not as clean as if it were closer to nadir. This parallax difference can be seen in the slider below
The imagery from the DNB on S-NPP, not shown, was extremely noisy, so the only real feature that could be seen was a lone lightning streak.
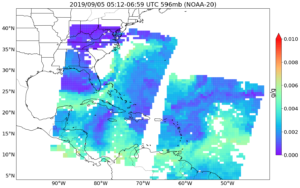
According to the 0900Z forecast discussion, Dorian is expected to see soon begin to experience increasing southwesterly shear, which should lead to a slow weakening during the next couple of days. Also of note is that the NUCAPS water vapor mixing ratio at mid-levels also shows drier air trying to wrap into the storm.
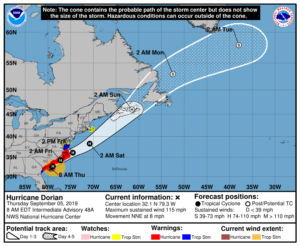
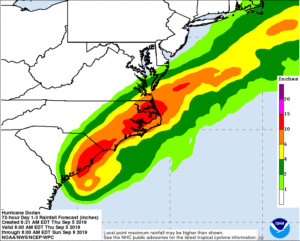
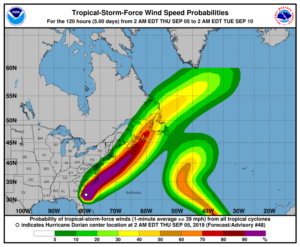
The current forecast track, the center of Dorian will move close to the coast of South Carolina today, and then move near (or potentially make a landfall) over the coast of North Carolina tonight and Friday. The dangers continue to be wind, storm surge and localized heavy rain causing local flash flooding.

