« Back to "Severe Tropical Cyclone Harold and Vanuatu - 5 - 8 April 2020"
Severe Tropical Cyclone Harold on 6 April 2020
Posted: April 6, 2020
On 4 April, Harold became a Category 5 severe tropical cyclone, the highest rating on the Australian scale. At 1200Z on 6 April 2020, Cyclone Harold had estimated winds of 145knt winds (~167mph) with gusts of 175kts, according to the Joint Typhoon Warning Center.
This is equivalent to a Category 5 storm on the Saffir-Simpson scale. At approximately 1359Z on 6 April 2020, NOAA-20 captured a near-nadir image of Cyclone Harold after it had passed over the provinces of Sanma and Penama. Media reports so large areas of devastation on the island of Espiritu Santo, the largest island of Vanuatu (population of approximately 40,000).
NOAA-20 again had a near nadir overpass at approximately 1340Z over Harold. Again, in the high resolution I05 (11μm) imagery, you can see that Harold is that it is a well defined storm with tropospheric gravity waves. The largest difference from the imagery on the 5th is that the eye was much smaller.
The Waxing Gibbous moon (96% illumination) again provided enough moonlight to show the visible features of the storm as it passed on the southwestern side of the island.
These same features are more easily in the zoomed in imagery, as shown below.
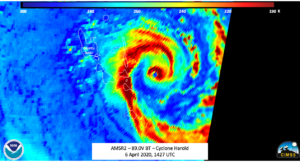
This time, GCOM-W1 flew over just to the west of Harold, approximately ~40min after NOAA-20 at ~1427Z. This provided a higher resolution observation of the inner structure of the storm. As can be seen in the image below, the circulation is near encircled by cold temperatures, with the convention favoring the northeastern side of the storm
This is consistent with what the ATMS instrument on NOAA-20 observed ~40 minutes prior.
These cold temperatures are also consistent with the location of the most convection is located in the VIIRS imagery as well.
Also of note is the long feeder band extending completely around the storm and (not shown) further north bringing in more moisture to the storm.
While VIIRS, ATMS and AMSR-2 provide high resolution imagery of the storm, they are only a fixed points in time. The AHI instrument on Himawari-8 instrument shows how Severe Tropical Cyclone Harold went over the southern tip of Espiritu Santo and weakened slightly, but re-emerged and re-strengthen as it passed further east.
AHI Imagery, courtesy of the CIMSS Satellite Blog (credit Scott Bachmeier and Scott Lindstrom)
The combination of both polar and geostationary imager plays a critical role in forecasting the intensity and strength of the tropical systems.
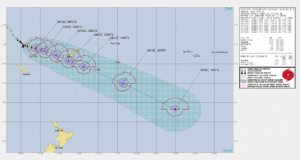
The 1200Z forecast graphic from the JTWC continues to show that Harold will impact Vanuatu for the rest of the day before moving off towards Viti Levu, which is main island of Fiji tomorrow.
As mentioned previously, there has been significant devastation seen on the island of Espiritu Santo as well as other islands. Unfortunately, humanitarian assistance is expected to be hampered due to the ongoing CoVID-19 pandemic due to restrictions on travel to Vanuatu.


