« Back to "Flooding from Imelda - September 19-22 2019"
Flooding from Tropical Depression Imelda seen on 19 September from Sentinel
Posted: September 19, 2019
Over the course of several days, Tropical Depression Imelda brought widespread flooding to southeast Texas, with particularly widespread heavy rains from Houston to Beaumont. There have been several reports of up to 40 inches of rainfall, including over 38 inches (97 cm) in Beaumont, TX and 41.81 inches (106.2 cm) inches of rain reported on I-10 between Winnie and Beaumont, TX. WFO Houston reported over 5 inches (13 cm) per hour in several places and in one case, 30 inches (76 cm) falling in just 12 hours. There were several reports of flooding and flash flooding in the area as many of the local bayous to flood their banks and flood residential areas. This caused the National Weather Service (NWS) in Houston to declare a flash flood emergency for parts of five counties in the southeastern area of the state, calling it a “PARTICULARLY DANGEROUS SITUATION” and urging residents to “SEEK HIGHER GROUND NOW!” In addition, George Bush Intercontinental Airport closed for about 90 minutes due to flooding on the runways, cancelling 655 flights.
Given that Imelda has remained nearly stationary has meant that traditional flood mapping from ABI, MODIS and VIIRS has been unable to see the extent of the flooding. In addition, traditional methods of looking for flooding do not work in low light conditions. However, this did not prevent two timely overpasses from the European Space Agency’s (ESA) Sentinel-1A/B satellites. As mentioned previously, data from these satellites is routinely collected by NOAA’s Satellite Oceanography and Climatology Division, specifically the Sea Surface Roughness Group at NOAA/STAR. This meant that during the storm while it was still raining, imagery showing flooding in the Houston area could be gathered and provided to stakeholders.
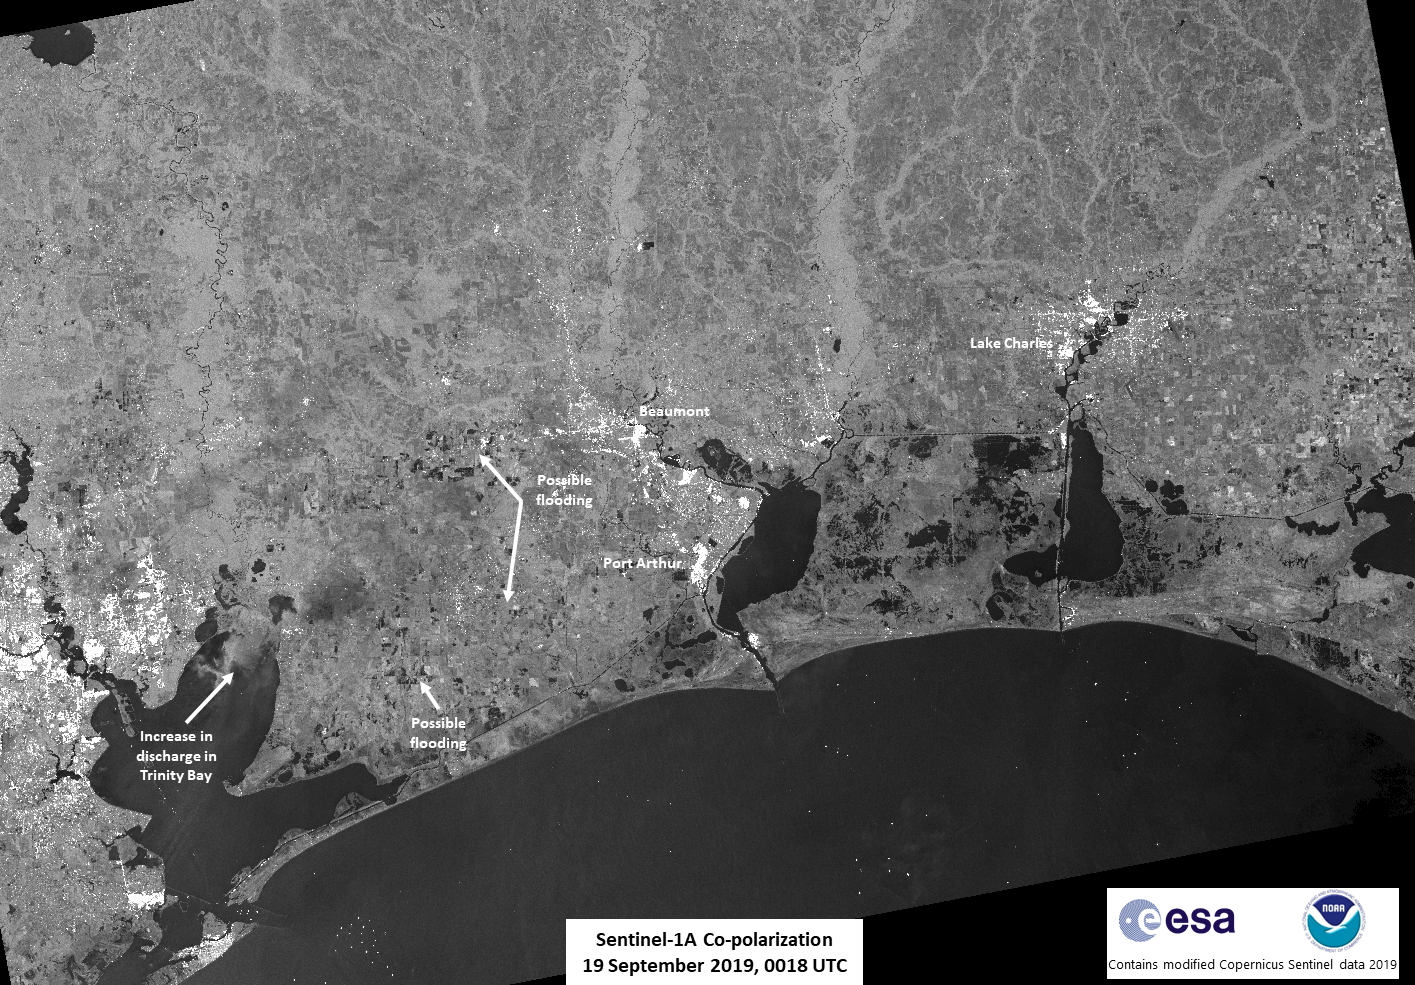
The first pass was from 0018Z on 19 September 2019 (7:18pm CDT on 18 September 2019). This imagery covered the areas from Lake Charles to Trinity Bay (east Houston), which were several of the hardest hit areas during Imelda. While not that obvious, there are areas of difference between the 7 and 19 September 2019 Sentinel-1A passes, as seen in the slider below
Sentinel-1A/B acquired by ESA/Copernicus, provided by Christopher Jackson, NOAA/STAR/SOCD
Contains modified Copernicus Sentinel data 2019
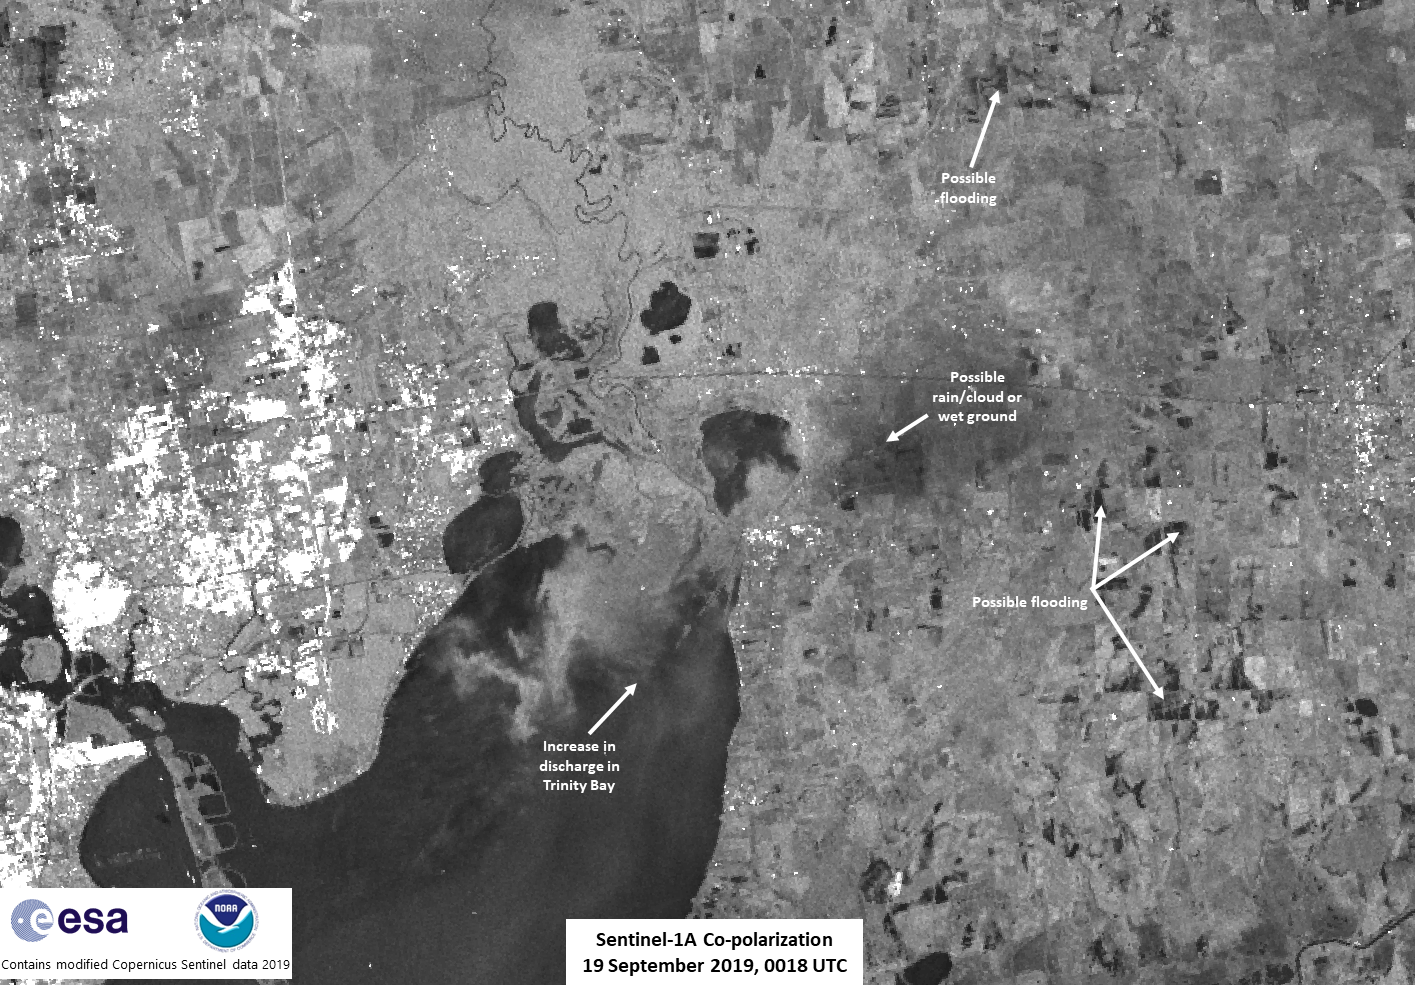
It is worth pointing out the discharge from the bayous that can be seen in Trinity Bay in the 19 September 2019 SAR imagery, which is an indication of excessive runoff coming from the intense rain.
Sentinel-1A/B acquired by ESA/Copernicus, provided by Christopher Jackson, NOAA/STAR/SOCD
Contains modified Copernicus Sentinel data 2019
There is also a much “whiter” features in Trinity Bay that can be seen near the discharge regions. Fortunately, the NWS NEXRAD in Houston got a scan and basically the same time as the Sentinel-1A pass. As can be seen in the slider below, the intense white features line up exactly where the most intense rainfall (highest DBz) is found from the ground based radar. Similarly the intense dark areas on land also line up with the highest reflectivity. The grayish area next to the intense rainfall could be lighter rain, silt stirred up from the bottom of the bay or discharge from the bayous.
Sentinel-1A/B acquired by ESA/Copernicus, provided by Christopher Jackson, NOAA/STAR/SOCD
Contains modified Copernicus Sentinel data 2019
NEXRAD data acquired from National Weather Service
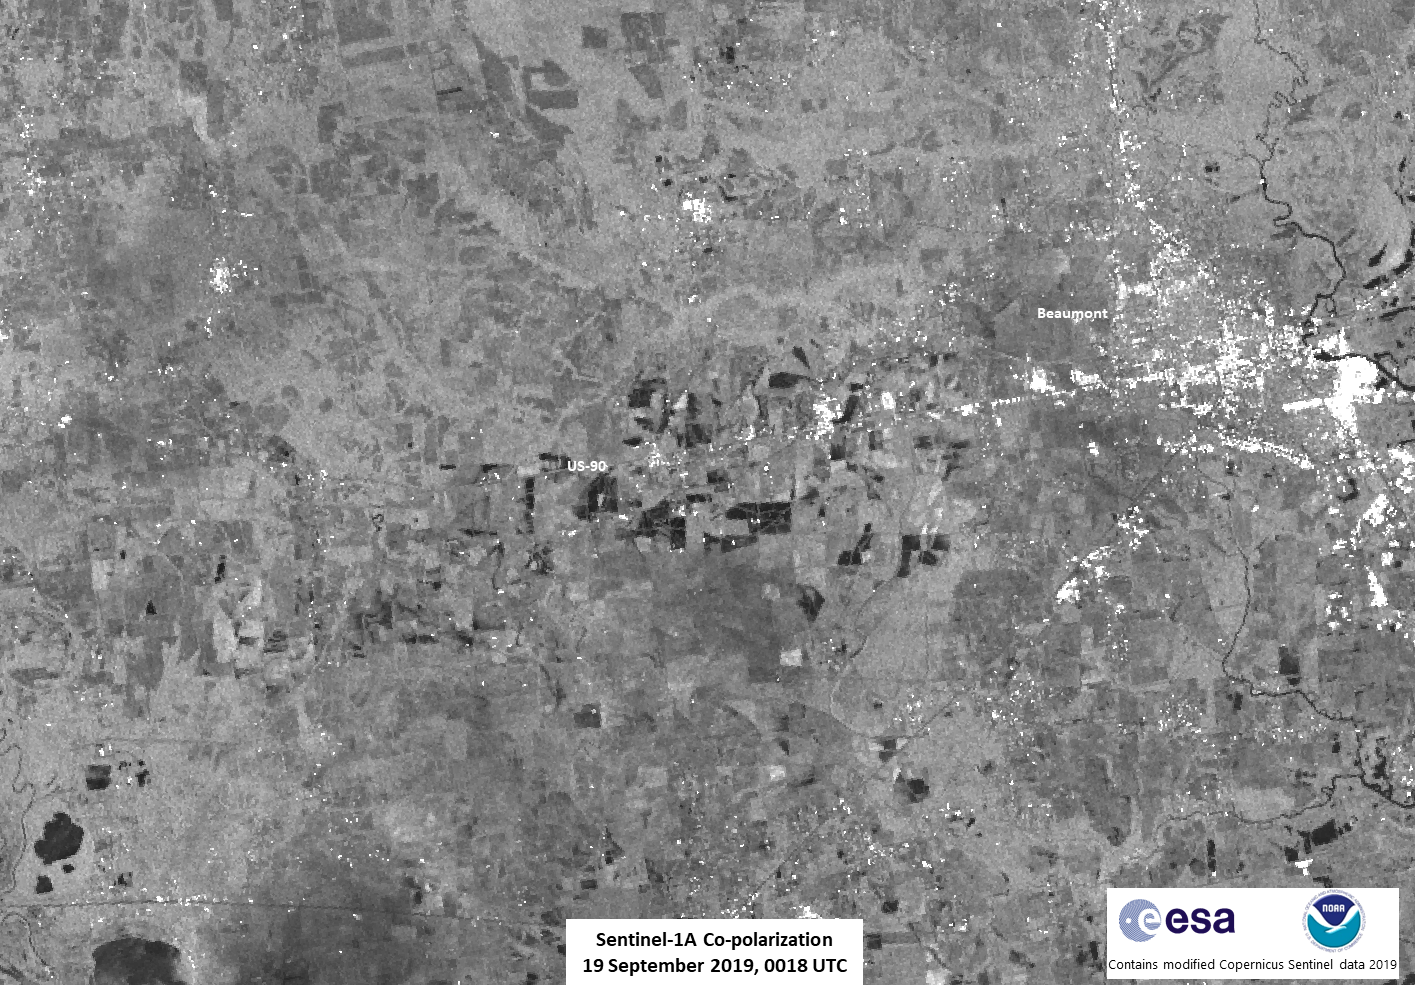
One can also see flooding in the region to the west of Beaumont, TX in Liberty County straddling US90, which can easily be seen in the SAR imagery.
Sentinel-1A/B acquired by ESA/Copernicus, provided by Christopher Jackson, NOAA/STAR/SOCD
Contains modified Copernicus Sentinel data 2019
The darker ground seen in the SAR data is where the ground is either saturated or has flooded, as indicated in the image below
Sentinel-1A/B acquired by ESA/Copernicus, provided by Christopher Jackson, NOAA/STAR/SOCD
Contains modified Copernicus Sentinel data 2019
During the height of the storm, Liberty County haf a shelter in place order, due to the amount of rain that was coming down.
The next pass was roughly 12 hours later at 1221Z on 19 September 2019 (7:19am CDT on 19 September 2019), again during one of the more intense rain bands from Imelda. While it did not cover the exact same region as the 0018Z pass, there were several interesting features that could be seen. For example, there was no discharge in Trinity Bay as well as the continued potential for flooding in Liberty County. However, as the slider below shows, there were no large areas of flooding, as compared to reference imagery taken on 7 September 2019
Sentinel-1A/B acquired by ESA/Copernicus, provided by Christopher Jackson, NOAA/STAR/SOCD
Contains modified Copernicus Sentinel data 2019
Unlike the flooding in the Midwest earlier this year, Imelda caused flash flooding as well as localized flooding. For example, one can see what appears to be a “dark” area west of Lake Houston along US90 south of Dayton, TX as well to the north of George Bush Intercontinental Airport, which can be seen in the SAR image from 19 September, shown below
Sentinel-1A/B acquired by ESA/Copernicus, provided by Christopher Jackson, NOAA/STAR/SOCD
Contains modified Copernicus Sentinel data 2019
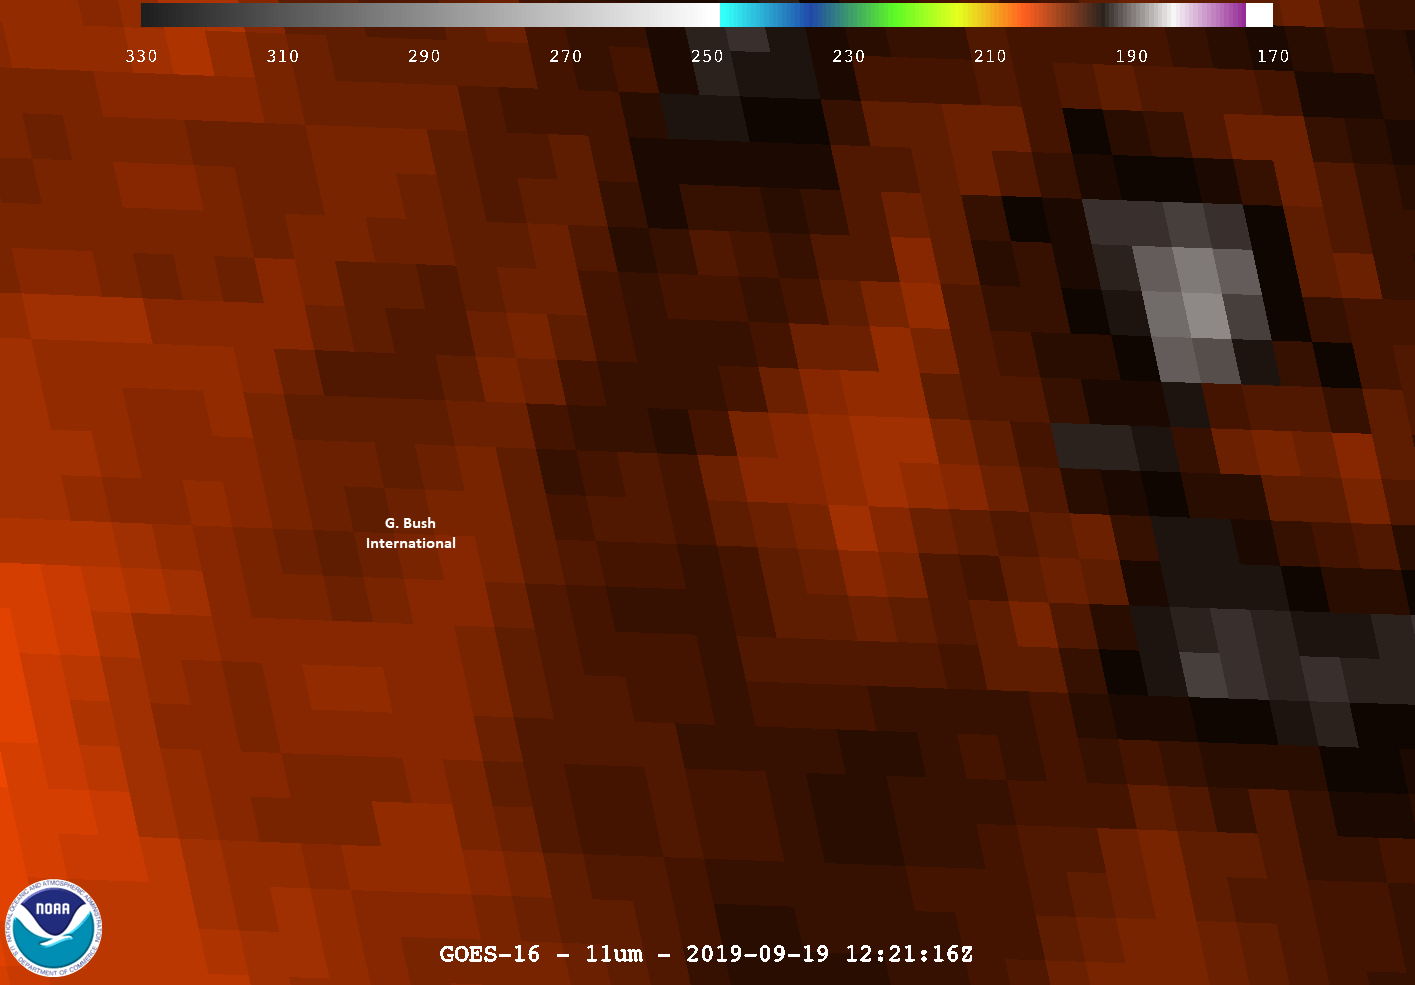
One could think that this is a large area of flooding or wet ground. However, as can be seen in the GOES-16 ABI Band-14 (11μm) BT imagery in the area west of Liberty, TX, one could see an intense storm in the area at the time of the Sentinel-1A pass
GOES-16 ABI Band-14 (11μm) from 1221UTC, received at CIMSS via GRB
This means that the dark areas with less defined land cover would suggest heavy rain conditions and/or wet ground conditions, which are prone to experience flash flooding. As with the 0018Z case, there happened to be a NEXRAD radar scan within a couple minutes of the SAR over pass. Again, note the correlation between the darker areas in the Sentinel data and the more intense returns from the NEXRAD data
Sentinel-1A/B acquired by ESA/Copernicus, provided by Christopher Jackson, NOAA/STAR/SOCD
Contains modified Copernicus Sentinel data 2019
NEXRAD data acquired from National Weather Service
One other thing to note is the areas in Liberty County, which also appear flooded due to the dark returns in the backscatter in the SAR imagery. As mentioned previously, Liberty County has a shelter in place order as Imelda was overhead, due to the amount of rain that had come down.
The areas seen in the SAR imagery are consistent with the following image that was posted on the NWS Forecast Office in Houston/Galveston, TX website on 21 September, showing the area south of Beaumont, TX receiving the bulk of the rain from Imelda
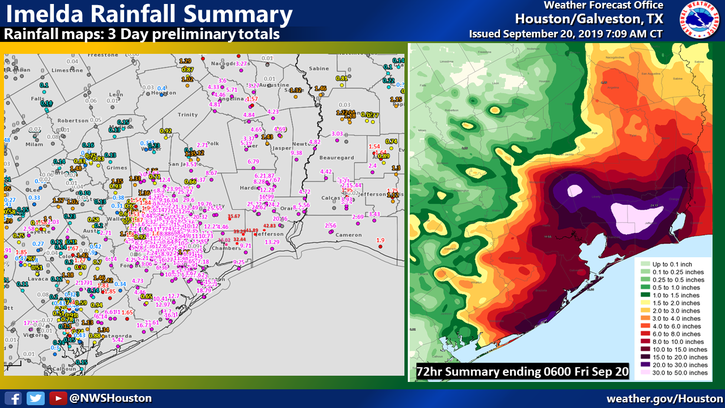
Image taken from NWS WFO Houston on 21 September 2019 at 4pm CDT
In development by the SAR Science Team, through the JPSS Proving Ground Risk Reduction initiative, such images are regularly produced flood/inundation maps and provided to stakeholders such as FEMA and the Texas Army National Guard to give an overview of the situation on the 19th at the height of the flooding. In the future, a more automated flood product utilizing SAR imagery will be developed. A sample of a derived product for this case can be found at the following link.