« Back to "2019 California Wildfiles"
Kincade Fire and California power outages on 29 October 2019
Posted: October 29, 2019
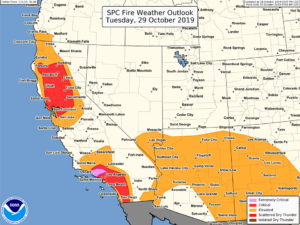
Over the last 4 days, the dangerous Kincade fire, which is near Geyserville in Sonoma County, has burned over a significant region, expanding due to dry conditions and strong winds. This combination of high winds and dry weather is a reason the National Weather Services’ Storm Prediction Center to issue an “extremely critical” fire weather outlook due to strong winds and low relative humidity to support critical to extreme fire weather conditions. While not as severe for northern California on 29 October 2019, southern California is under the “extreme” risk for fires
Image from NWS Storm Prediction Center Facebook page on 28 October 2019 at ~3pm PDT
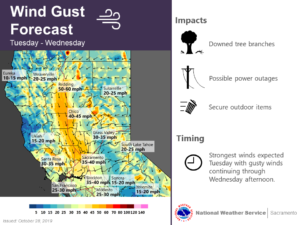
Winds for the region were predicted to be extremely high, as shown in this info-graphic from the NWS Forecast Office in Sacramento, CA.
Image from NWS Forecast Office Sacramento, CA website on 28 October 2019 at ~3:46pm PDT
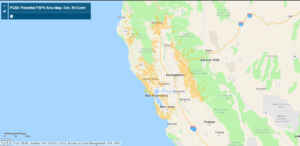
As mentioned on 26 October, Pacific Gas and Electric (PG&E) planned to cut off power to customers due to winds reaching in excess of 80 mph. The screenshot below, taken at 4:20pm PDT on 28 October 2019,shows the area where PG&E planned to cut off power to try and prevent new wildfires from starting, called a Public Safety Power Shutoff (PSPS) event. PG&E has set up an interactive map here that shows the ares that will be impacted. These areas have changed slightly from the 26-28 October events.
Image from Public Safety Power Shutoff (PSPS) event page on 29 October 2019 at ~4:17pm PDT
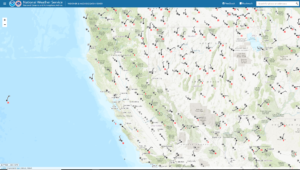
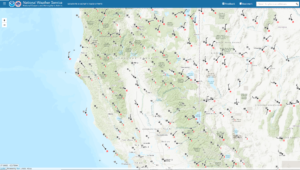
As seen by the National Weather Service’s Weather & Hazards Data Viewer website, at the ~3:00am, winds continue to be light over the state of California in the morning, which means there is less chance for rapid fire growth
Screenshots from National Weather Service’s Weather & Hazards Data Viewer website on 29 October 2019 at ~3:03am PDT
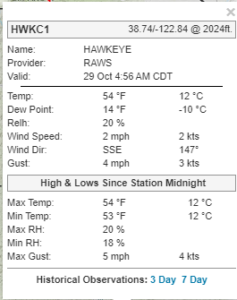
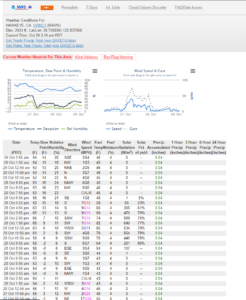
In fact at one of the RAWS stations near the Kincade fire, there were very light, with wind gusts of close to 4mph
Screenshot from National Weather Service’s Weather & Hazards Data Viewer website on 29 October 2019 at ~2:56am PDT (4:56am CDT)
However, note the extremely low dewpoints, which can enhance the fire risk due to the air being so dry.
Screenshot from National Weather Service’s Weather & Hazards Data Viewer website on 28 October 2019 at ~3:30am PDT
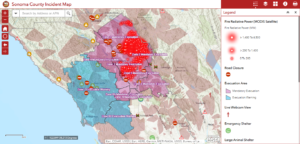
As of the 7:36am PDT on 29 October, CalFire reported that the fire had more than doubled in size, and was approximately 75,415 acres in size and was now 15% contained. At least 124 structures destroyed with 2 injuries confirmed. While some of the evacuation zones were moved to evacuation warnings, there are still large portions that are under a mandatory evacuation notice. However, most of Sonoma County all the way to the Pacific Ocean and into Napa Valley are either in a mandatory evacuation or an evacuation warning. This can be seen in the screenshot below from the Sonoma County Incident Map.
Screenshot from the Sonoma County Incident Map website on 28 October 2019 at ~4:14pm PDT
This shows that there are mandatory evacuations into the town of Healdsburg and encroaching on Santa Rosa, CA. This means nearly 185,000 people have been forced to evacuate their homes.
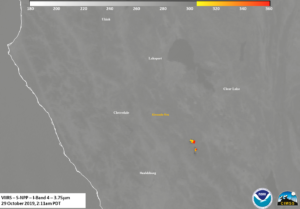
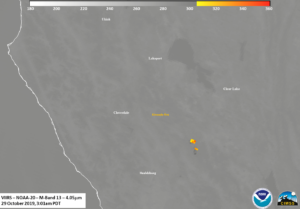
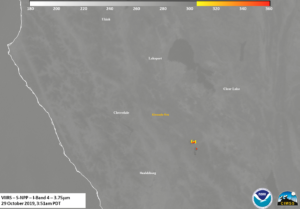
The Kincade Fire was first observed by S-NPP at ~2:11am PDT (0911UTC) on 29 October, on the western side of the pass. It is important to note that because the fire is at elevation, there are some parallax effects due to it being on the edge of the scan, despite the terrain correction applied to the geolocation data. One thing that can be seen is that the high resolution I04 (3.75μm) is that there is only a small area that had significant hot spots
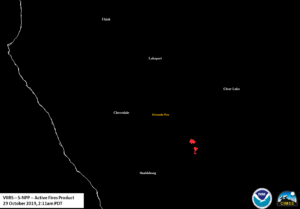
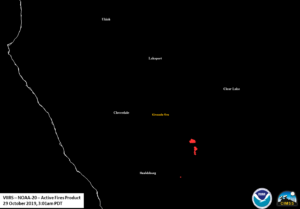
This also corresponds to the locations of the hot spots seen in the VIIRS Active Fire (VAF) Product, as processed by CSPP.
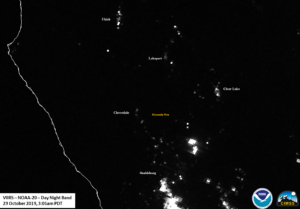
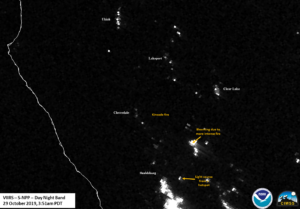
The Day Night Band, which had no illumination due to it being a new moon, had a bit of blooming, possibly due to the thermal effects of the fire in the DNB, as previously discussed, or due to the fire being on the edge of the scan.
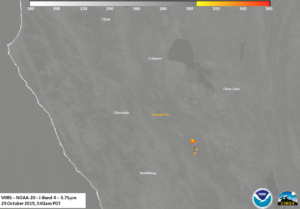
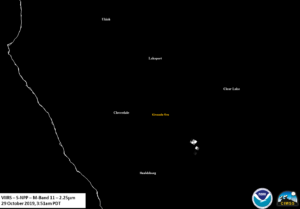
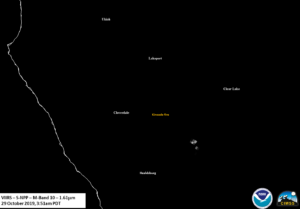
The next polar satellite to see the fire was NOAA-20 at 3:01am PDT (1001 UTC), which caught the fire close to nadir. This meant that the satellite was able to observe the fire with the best possible view, eliminating the edge of scan effects. One difference between the S-NPP and NOAA-20 pass seen in the M10 (1.61μm) channel, which can also be used for fire detection at night, is a very faint hot spot in the Southern Alexander Valley.
This spot is also picked up in the other fire detection channels as well as the Day Night Band
As well as in the VIIRS Active Fire (VAF) Product
What makes this hot spot interesting is that was seen in the Day Night Band in the next pass that saw the Kincade Fire, which was S-NPP at ~3:51am (1051UTC)
but not any of the other channels or the VIIRS Active Fire product
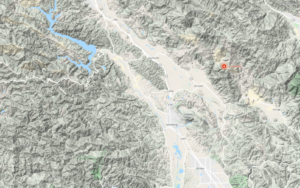
This could mean there was a brief flare-up in the Southern Alexander Valley that was not observed due to the fact that the thermal signature was slightly obscured due to the terrain effects (i.e being behind a hill). If you look at the terrain, as shown by the screen capture from Google Earth.
Screenshot from Google Earth on 28 October 2019 at ~3:30am PDT
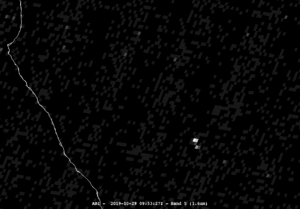
It is also worth noting that the GOES-17 imagery does not see this brief flare up in any of the imagery. This is likely due to the fact that the feature is small enough that it cannot be seen due to the resolution of the ABI. However, it is important to note the ABI imagery and fire products are critical to the initial detection as well as showing the temporal change of the fire.
As can be seen in the following sliders, which show the temporal change between two successive polar orbits of the I04 (3.75μm), M13 (4.05μm), M11 (2.25μm), Day Night Band and finally the VIIRS Active Fire Product, the fire was primarily regulated to areas of steeper terrain that is harder to access for firefighters.
Power outages
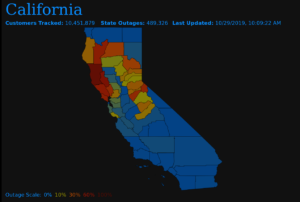
At ~3:10amPDT, which was about the time of the NOAA-20 overpass, roughly 489,326 customers were without power, primarily in northern California, as seen in the screenshot from poweroutage.us, with virtually all of them being from PG&E. That is roughly 10% of all PG&E customers (~5.2million customers total) and about 5% of all customers in all of California (~10.5 million customers total). This is a significant amount less than yesterday, but still affecting similar regions
Screenshots from poweroutages.us on 29 October 2019 at ~3:10am PDT
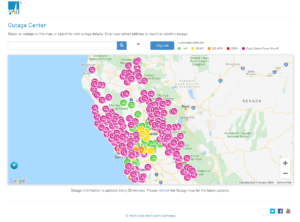
Outages from the Pacific Gas and Electric outage website taken at approximately 3:03am PDT this morning also showed a similar distribution of outages.
Screenshots from PG&E’s Outages tracker website on 29 October 2019 at ~3:03am PDT
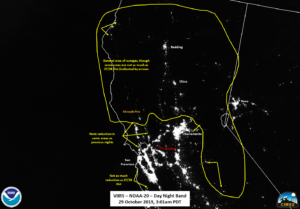
Utilizing the best possible view, the NOAA-20 pass from ~3:01am PDT on 29 October 2019, one can do a comparison between the imagery from the morning of 23 October 2019,
This shows that the areas are consistent with the outage trackers. It is also worth noting the comparison with 27 October 2019, which shows that there were fewer people affected by the PSPS.
As of the fire incident update at 7am PDT, CalFire noted that favorable weather conditions have enhanced firefighting efforts during the morning hours, while narrow roads and steep terrain are still making access to the fire areas difficult. Forecasts have winds picking up in the evening, so firefighters will continue to mitigate structure threats and find opportunities to construct control lines. Approximately 4,548 personnel are assigned as of the 7am update with 27 helicopters working fire suppression.

