« Back to "2019 Australian wildfires"
Australian Wildfires from VIIRS and NUCAPS
Posted: November 18, 2019
Starting on about 8 November 2019, bushfires spread across two states of Australia burning over a million hectares of land. Tinder-dry conditions coupled with high temperatures, unpredictable winds and lightning have placed ‘catastrophic’ threat levels in place across Queensland and New South Wales. Over 200 homes have been destroyed and bushfires approached within 15km of Sydney’s city centre. Over 3000 firefighters have been tackling the bushfires, assisted by personnel from New Zealand and the Australian Defence Forces on a front spanning 1,000km along the north coast of New South Wales. As a result, the International Disasters Charter was activated to assist in the response to the fires.
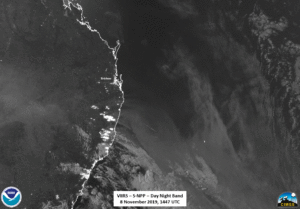
As one might expect, these intense fires have produced large amounts of smoke, which have encompassed the region, including Sydney, Australia. The evolution of the fire over successive nights can be seen in animated Day Night Band image (click to see animation)
In addition, in the nights chosen, the moon was above the horizon encompassed the Waxing Gibbous moon, on 8 November 2019, to the waning gibbous moon, on 15 November 2019. This allowed for features such as clouds and smoke to be seen in the imagery.
As mentioned in previous posts, the NOAA Unique Combined Atmospheric Processing System (NUCAPS) can not only produce soundings, but can produces information of trace gases at various pressure levels to give an idea of the surrounding environment in regions were sounding data might not be readily available. While the water vapor mixing ratio has previously been shown for applications in hurricane forecasting, NUCAPS can also produce information about other trace gases such as methane (CH4), ozone (O3) and carbon monoxide (CO). Some of these traces cases, such as ozone, can be hazardous to human health, especially those with breathing issues. Others are greenhouse gases, such as methane, or are atmospheric pollutants. A new experimental product is being developed to produced the gridded NUCAPS data in a netCDF format, which would allow for direct comparisons to VIIRS and other imagery for users outside of AWIPS2. A demonstration of this is shown in the slider below, which shows the carbon monoxide from two levels in the atmosphere derived from the NUCAPS sounding at ~0234UTC on 11 November 2018, with one being at 403mbar and the other at 760mbar taken on .
It is expected that the highest concentrations of CO would be higher in the atmosphere, as they have been lofted by the intense heat from the fires, there is a noticable high concentration of CO at mid-levels in the atmosphere. This is is an indictation of a potentially thick region of smoke. In fact, if you look at the I01 (0.64μm) from 50 minutes later from NOAA-20 (shown because it provides context of where the smoke originates, one can clearly see that the area of higher CO at mid levels is associated with the thicker region of smoke


