« Back to "2019 Australian wildfires"
Australian wildfires from 17 December 2019
Posted: December 17, 2019
The wildfires in Australia have continued to burn and continuing to produced large amounts of smoke, which have encompassed the region, including Sydney, Australia. In addition, 17 December 2019 was the hottest average temperature on record for Australia, with a nationally averaged temperature of 105.6 °F (40.9°C), according to the Australian Bureau of Meteorology.
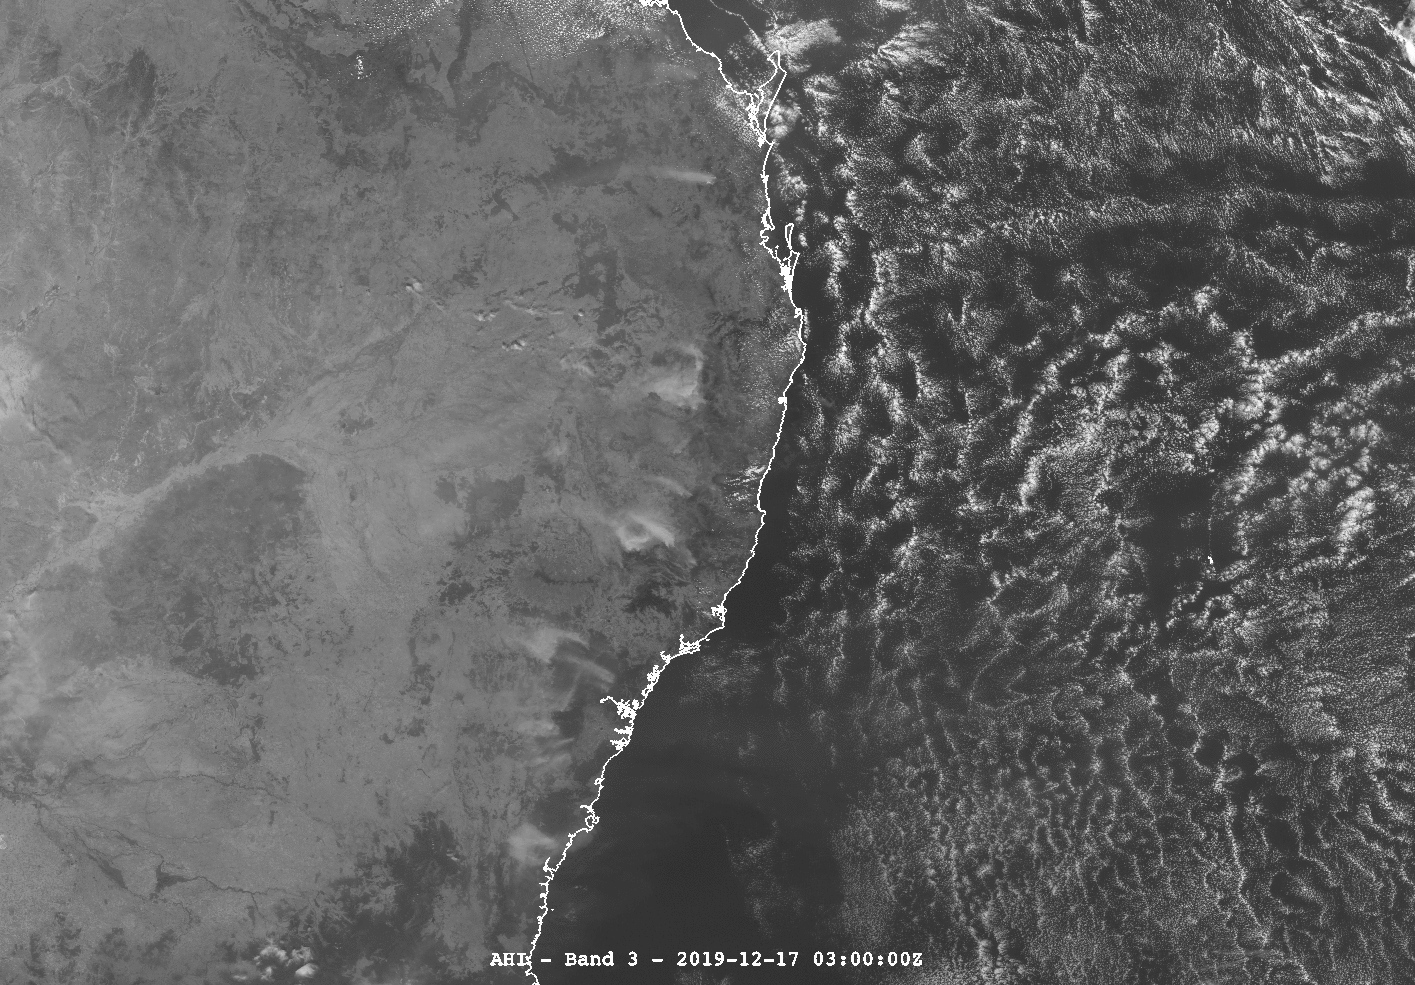
The smoke from the large wildfires were easily seen during the day by the Advanced Himawari Imager (AHI) on the Japanese Meteorological Agency’s operational geostationary satellite, Himawari-8. As seen in the Band 3 (0.64μm) channel from 0300-0350Z, the smoke can be seen travelling inland and then wrapping around to the south and back over the coast.
In addition, Band 1 (0.47μm) on AHI, which is also on the GOES-R Advanced Baseline Imager (ABI), is also extremely useful for aerosol and smoke detection, which can easily be seen in the animated (below) and static imagery.
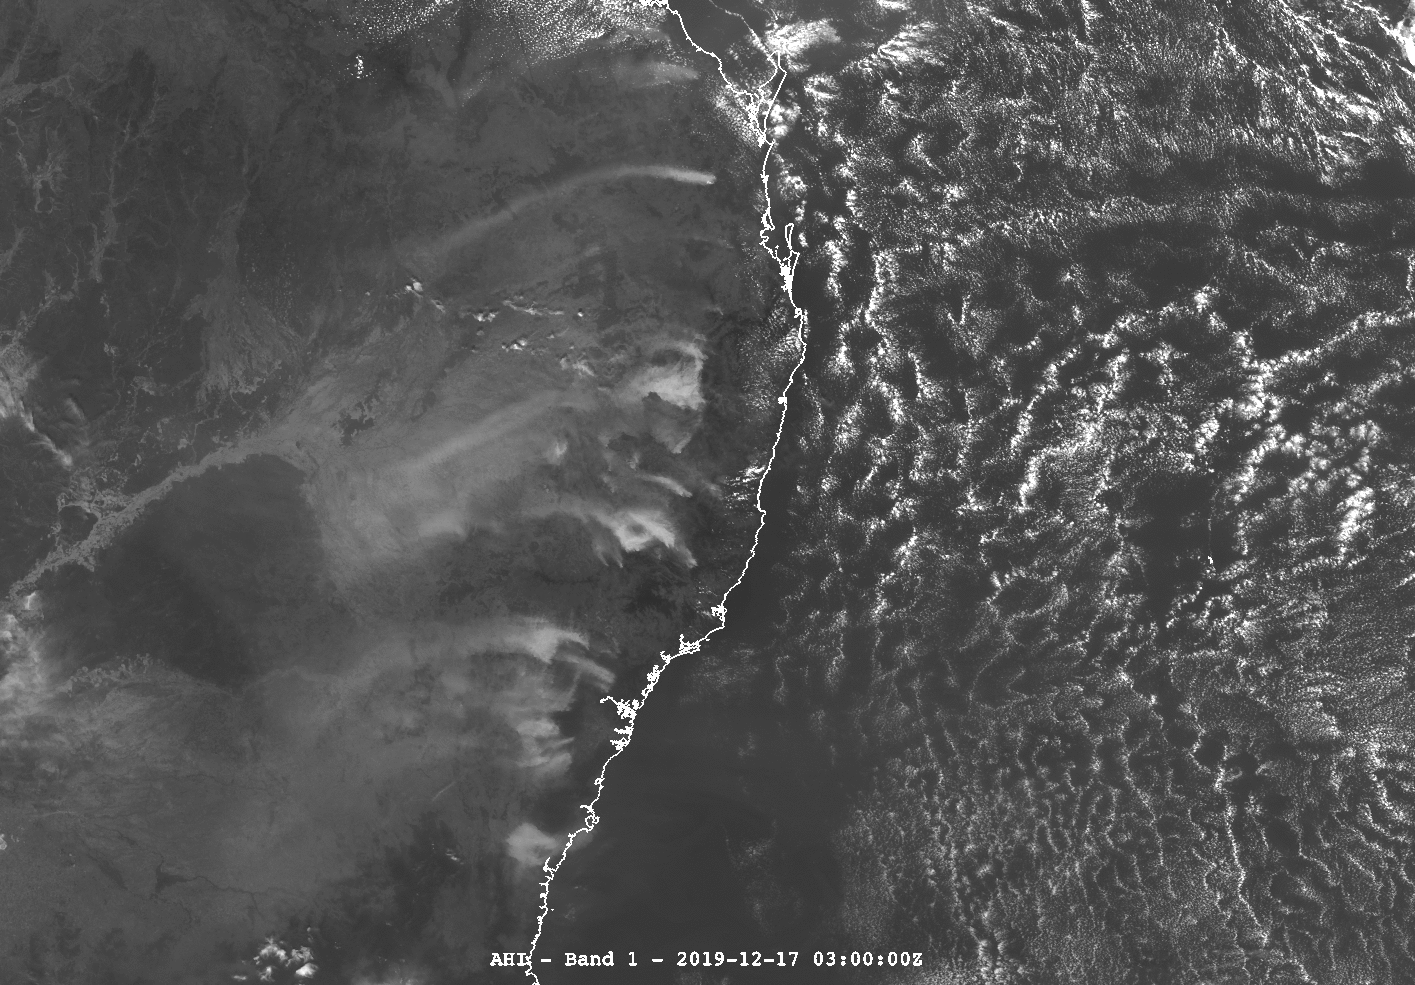
Again, note how the smoke is being blown inland before wrapping back around to the south and then back out over the ocean. This large amount of smoke cause the amount of pollution to be 11 times higher than the threshold for “hazardous” according to a collation of doctors in Australia and New Zealand.
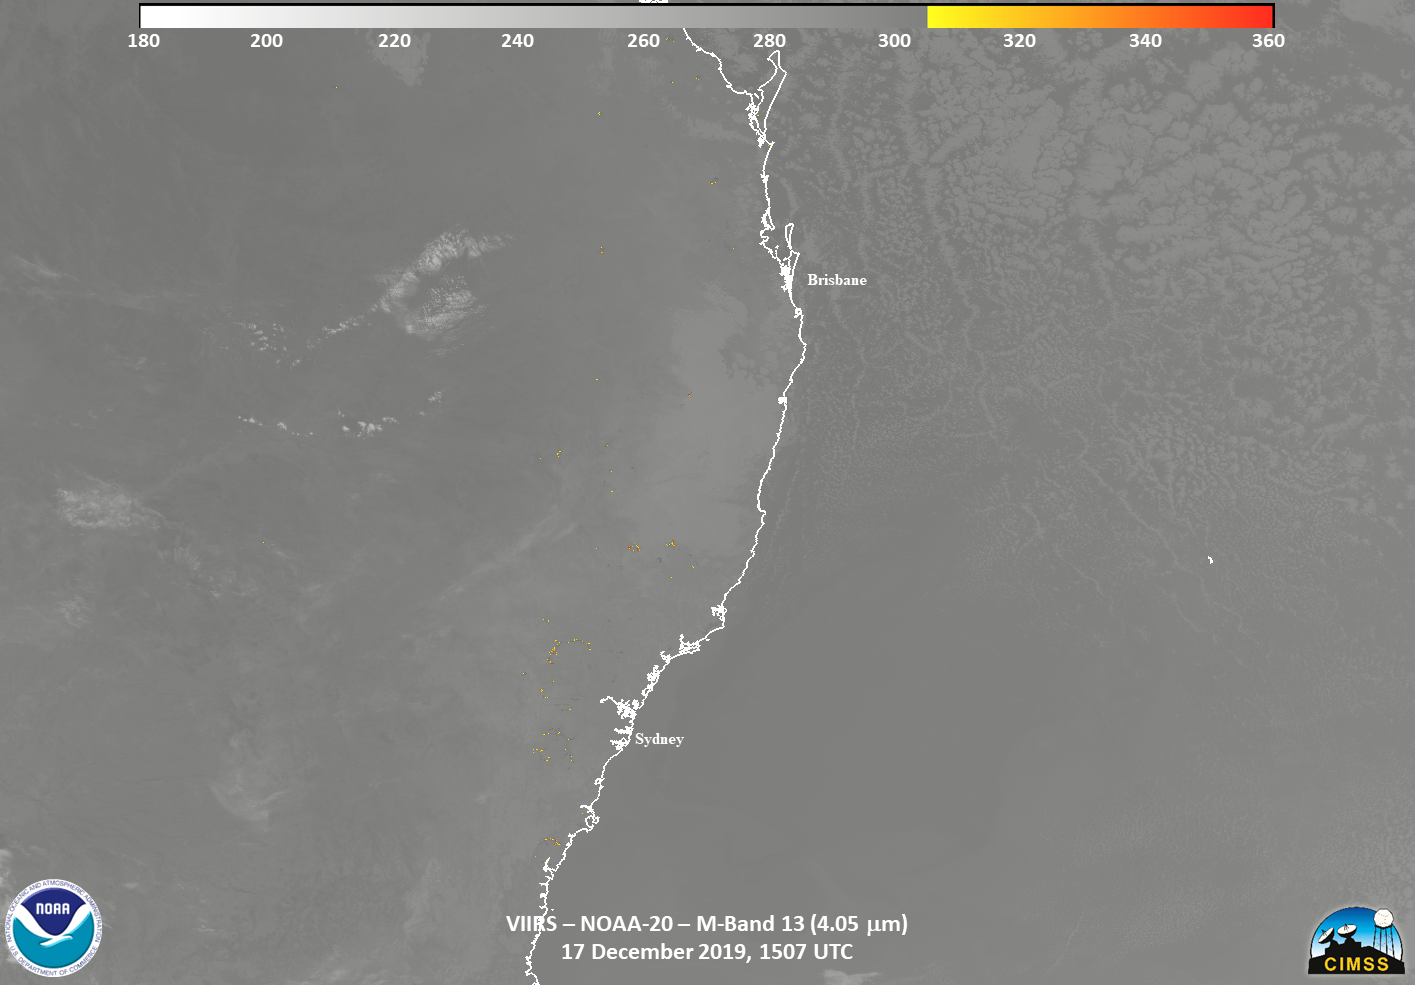
These fires also line up very well with the VIIRS Active Fire product, as run at NESDIS/STAR for the near-nair daytime overpass from NOAA-20, which occured at ~0350Z on 17 December.
As well as lining up with where the smoke was visible in the I01 (0.63μm) imagery from VIIRS
While the geostationary satellite do provide a way of detecting aerosols and smoke through imagery as well as algorithms, such as the GOES-R Aerosol and Smoke algorithm, there is no real way of telling where and how much trace gases, such as carbon monoxide (CO), exist over these regions. Several of these trace gases, such as ozone and CO, can be hazardous to human health, especially those with breathing issues. This is where derived products from the NOAA Unique Combined Atmospheric Processing System (NUCAPS) can prove useful. It is expected that one would have higher total column concentrations of CO as the intense fires burned. So in the during the afternoon pass, one would expect to see some CO in the atmosphere
with smoke primarily being blown out over the ocean. It is also interesting to do a comparison with the Sentinel-5 Precursor satellite’s TROPOMI Vertical Column CO at 0301 UTC, roughly 50 minutes before the NOAA-20 overpass. When comparing to the AHI Band 1 image at roughly the same time, one can see excellent alignment with the visible smoke as compared to the measured CO from TROPOMI
However, while there is some agreement for the larger wildfires between Sydney and Brisbane, there is not so much agreement with the NUCAPS CO and TROPOMI data over the ocean
This is to be expected, given that TROPOMI has a resolution of 7.2km x 5.6km, which is much higher than the resolution of the gridded NUCAPS product. The addition of the TROPOMI data could be used with NUCAPS datain a similar manner to how VIIRS data is used in combination with geostationary data. That is to say, the higher temporal NUCAPS data (which is produced from the two JPSS satellites as well as MetOp-A/B/C) could be then supplemented with higher resolution, lower latency, information from the Sentinel-5 Precursor mission as well as Sentinel-5.
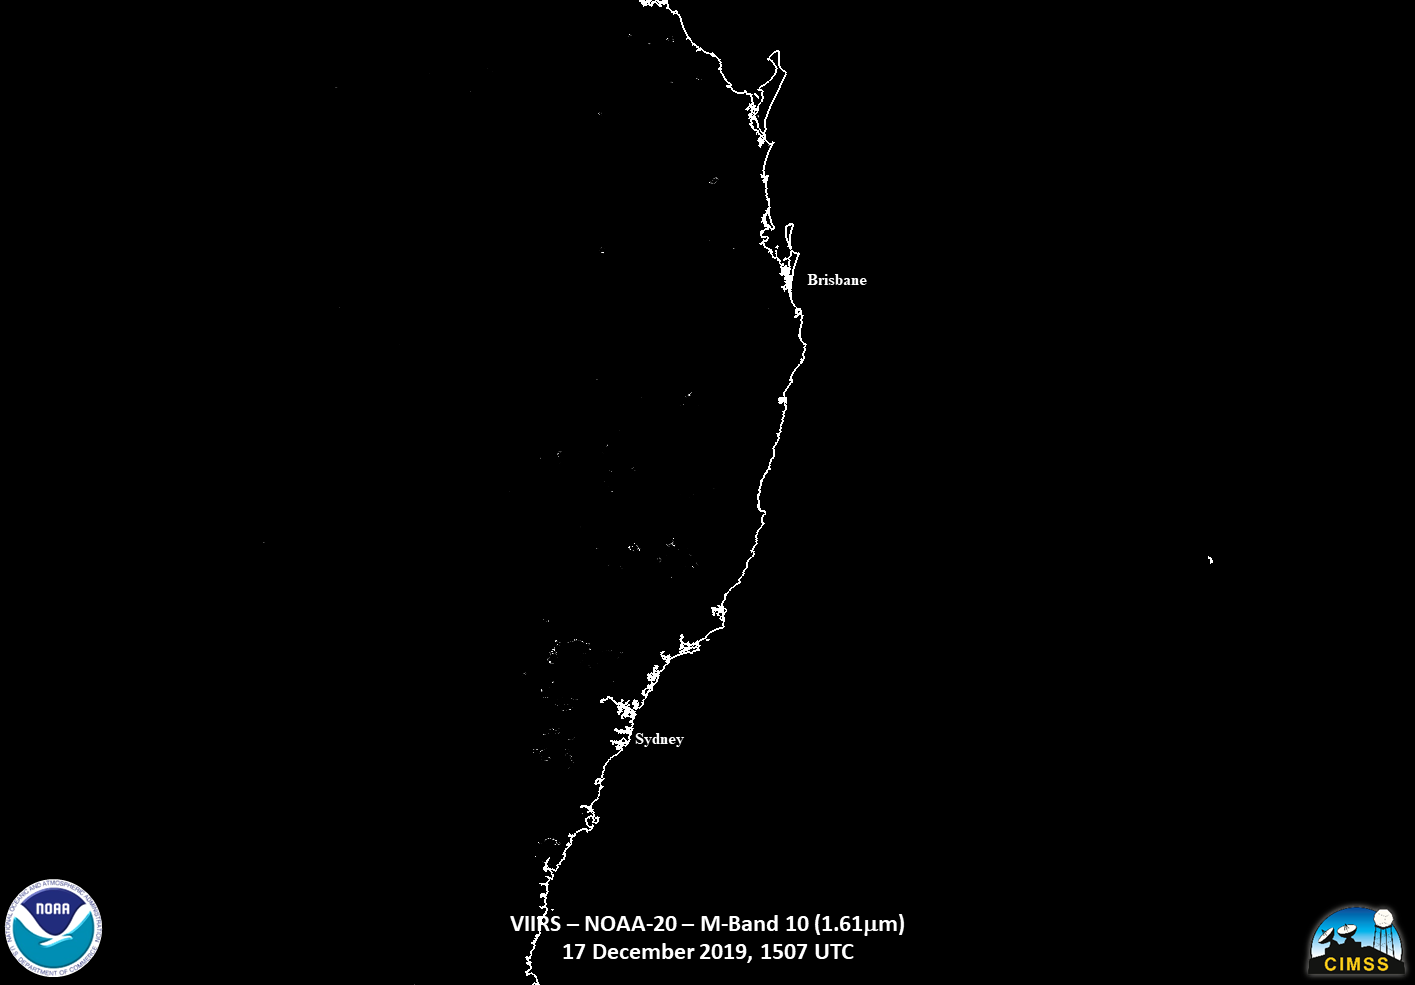
At night, one would expect the inland concentrations to go up, as the there is less wind blowing (i.e. the smoke is not being pushed around as much). The situation at night was such that there were differences in the number of fires observed by NOAA-20 at ~1507UTC as compared to ~12 hours prior as seen by the VIIRS Active Fire Product.
The fires observed correspond well with the I04 (3.75μm), M13 (4.05μm), M10 (1.61μm), and M11 (2.25μm) imagery, as shown below


While the waning gibbous (69% illumination) moon was just above the horizon for the NOAA-20, there was enough moonlight to illuminate features such as clouds and smoke in Day Night Band imagery. In fact, there was enough light to cast shadows from some of the clouds in the scene.
Since there was enough light to see the smoke, one can compare the NUCAPS total column CO to the visible DNB imagery.
As you might expect, the highest total CO regions are associated with the locations of where the smoke can be seen in the DNB.
This gives confidence that the retrievals from NUCAPS are reporting CO where smoke is present. This is important since NUCAPS can be retrieved from a variety of instruments and is not limited to visible imagery, like imager-based aerosol detection algorithms. This now provides another possible tool for forecasters to use when trying to observe trace gases that have potential harmful health effects.