« Back to "Hurricane Storm Dorian Aug 28 - Sep 6 2019"
Hurricane Dorian from 29 August
Posted: August 29, 2019
To start, Puerto Rico and the US Virgin Islands were cloudy at the time of the S-NPP and NOAA-20 passes. This meant that no analysis of the small number of outages in that region.
At the 5am AST (0900UTC) public advisory, Hurricane Dorian had winds of 85mph, making it a Category 1 storm. There was no change in the wind speed from the 11pm (0300Z) public advisory from 28 August 2019. However, the pressure rose from 986mbar at 3Z to 911mbar at 9Z. Note there was no 0600Z advisory today.
NPP, GCOM-W1 and NOAA-20 all passed over Dorian all within 50 minutes and each observing unique features as it was pulling away from Puerto Rico and the Virgin Islands. This discussion will step through the VIIRS imagery first and then move on to the microwave instruments (ATMS and AMSR2).
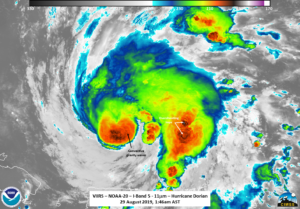
At ~0546 UTC (1:16 am AST), NOAA-20 caught Dorian again at close to nadir. The circulation was easily seen as Dorian developed. Multiple overshooting tops and convective gravity waves can be easily seen, both near the circulation center as well as in the feeder band.
The southern side of the storm was was primarily lower stratus clouds. The waning crescent moon (1% illumination) meant that the storm was illuminated by airglow. This allowed for the mesospheric gravity waves were easily seen. In addition, there were a couple lightning streaks on the eastern side of the storm.
But the interesting feature was on the western side of the storm. There was a couple pixel line that went across scan. This could possibly be a streak from a small bolide (indicated by the orange arrow below), something that we’ve seen previously in the Day Night Band.
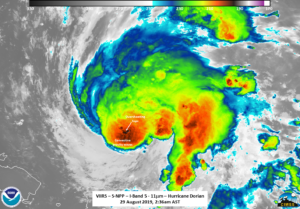
Roughly 50 minutes later at ~0636, SNPP caught Dorian on the east side of the scan. This meant that parallax was present which means the storm appears to shift to the east.
However, one could see the rotation of the storm and the convection building near the center of circulation.
While not shown, the DNB did appear to exhibit some mesospheric gravity waves. Like yesterday, they were not easily identifiable due to Dorian being on the edge of the scan for S-NPP.
Even with the circulation being easier to see based on the feeder bands seen in the IR imagery, the actual center of circulation in the right place. As mentioned yesterday, in order to get a better idea of where the circulation is located, one needs to use aircraft (in the Atlantic basin) as well as microwave imagery from a variety of satellites. The ATMS brightness temperatures on NOAA-20 doesn’t really show the circulation center, though it is a little easier to see than yesterday.

However, the MiRS Rain Rate product was able to pick out the circulation a little better than the brightness temperatures, as can be seen in the slider below.
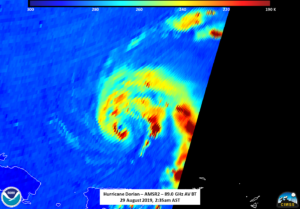
At ~0634UTC, the AMSR2 instrument was able to catch Dorian on the east side of the scan. Even with it being on the edge of the scan, the eyewall and circulation could easily be seen.
All of the sensors from all three satellites, including the VIIRS imagery, could see a dry slot penetrating into the southeastern portion of the circulation. This would support the NHC forecast discussion at 0900Z where they noted that Dorian appeared to have a bit of a hiccup in its structure due to the dry slot.
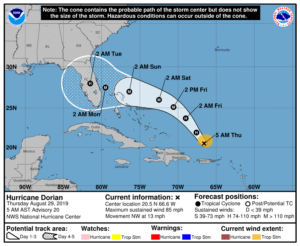
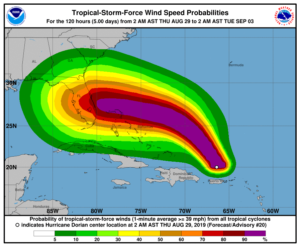
Current models suggest that Dorian will be tracking across the central part of Florida on Tuesday and potentially re-emerging into the Gulf of Mexico next week.
Warning cone and wind forecast taken from NHC Graphics page for Hurricane Dorian on 29 August 2019 at 11am CDT
FEMA and other stakeholders are currently monitoring the situation for impacts to the Continental United States.

