« Back to "Tropical Storm Barry 11-15 July 2019"
Tropical Storm Barry – observations of flooding utilizing other satellite sources
Posted: July 16, 2019
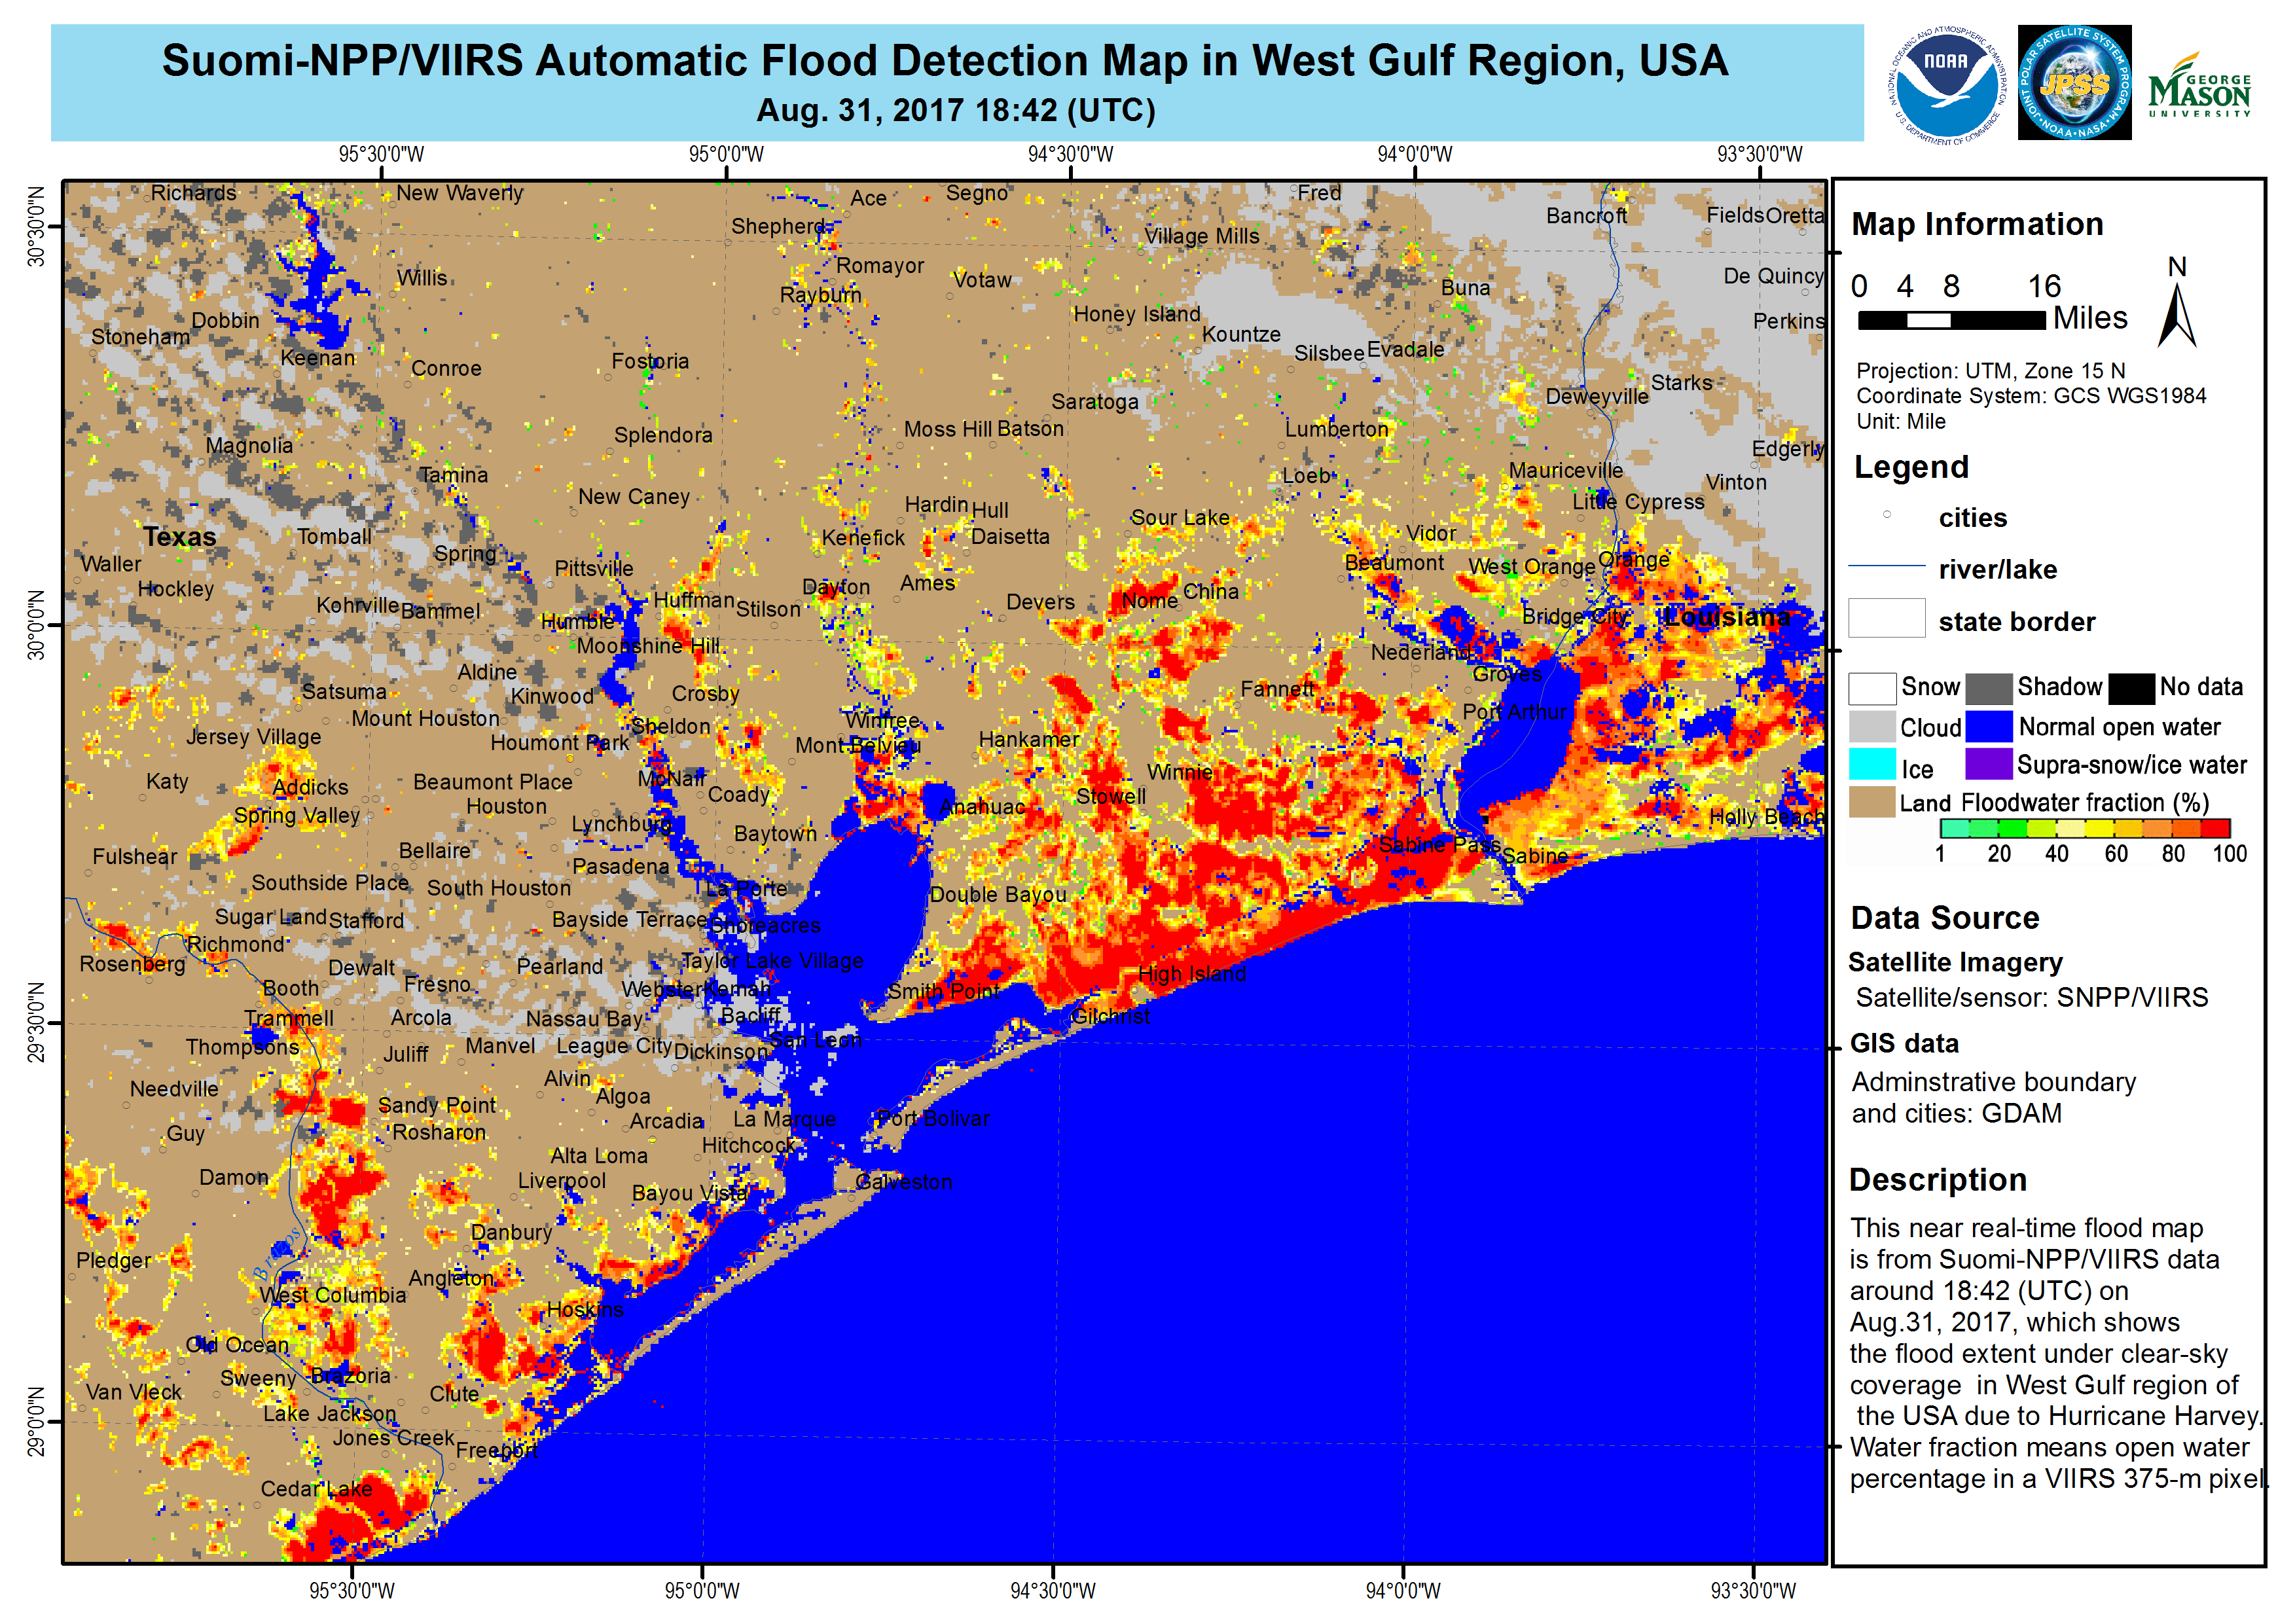
Most tropical systems are fairly fast moving, allowing for spaceborne imagers, such as VIIRS and ABI, to observer and determine where flooding occurs. This can be done using algorithms such as the one developed by Sanmei Li at George Mason University and run routinely at the Cooperative Institute for Meteorological Satellite Studies (CIMSS). This algorithm has been proven extremely useful in responding after flooding events, such as Hurricane Harvey in 2017
Image from STAR/JPSS website on Hurricane Harvey.
However, there have been several storms, such as Harvey(2017), Florence(2018), and Tropical Storm Barry (2019), where clouds linger over the region causing flooding to occur during the event. This means that the traditional flood products are unable to see the flooding as it occurs. In addition, the imager based algorithms require there to be visible light.
In order to expand the capabilities to cloudy as well as nighttime flood mapping requires a different tool, which comes in the form of Synthetic-aperture radar (SAR), which is on-board several non-US satellites. These include the European Space Agency’s (ESA) Sentinel-1A/B satellites as well as the Canadian Space Agencies RADARSAT. The SAR is able to provide imagery through the cloud, since it uses successive pulses of radio waves (i.e. a radar) are transmitted to “illuminate” the ground to create two-dimensional or three-dimensional images, such as landscapes. Since the radar is moving as the satellite orbits the earth, the antenna position changes relative to a given target (i.e the ground), the signal changes. These each successive signal is processed and combined to create creation of high-resolution images than would otherwise be possible with a just a single antenna.
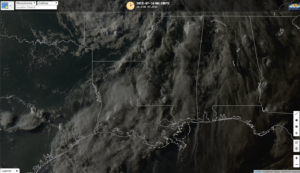
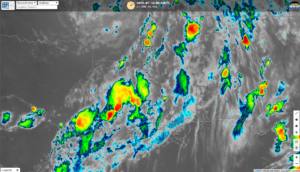
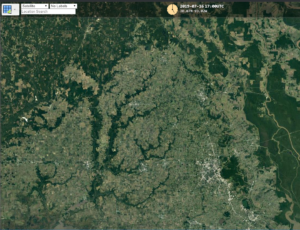
An example of how this can be used can be shown below from 16 July. The Sentinel pass occurred at roughly 0010 UTC on 16 July 2019 (7:10pm CDT on 15 July 2019). As can be seen in the true color and 10.3μm brightness temperature (taken from RealEarth), the area over Louisiana was completely cloudy
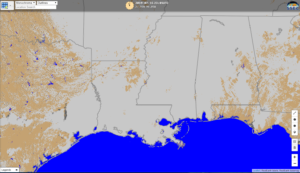
and also can be seen in the daily VIIRS composite
In addition, at the time of the Sentinel pass, the sun was below the horizon. Each of these means that the imager based flood mapping algorithms would not be of use. However, through the usage of the SAR data, one can do a direct comparison of a before and after observations (just a comparison of the raw data, geoTIFs available on request)
Sentinel-1A/B acquired by ESA/Copernicus, provided by Christopher Jackson, NOAA/STAR/SOCD
Contains modified Copernicus Sentinel data 2019
As can be seen in the slider, it appears there is some flooding that is visible in the SAR west of the Mississippi river in the approximate box 30.8N to 30.3N and 93W to 91.7W. This area is primarily marsh and farmland, thus susceptible to flooding after intense rains.
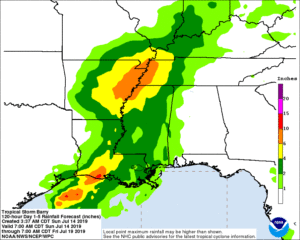
It is also worth noting that this area the same region that the Weather Prediction Center had predicted the most intense rains to occur
QPE rainfall forecast taken from NHC Graphics page for Tropical Storm Barry on 14 July 2019 at 7am CDT
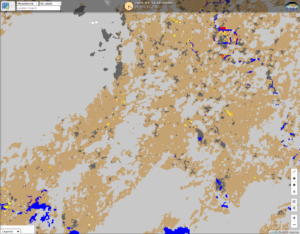
Unfortunately, due to the fact that the pass was done at night, there were no corresponding ABI or VIIRS imagery to look at. However, ABI flood map imagery from 16 July at 1700Z indicated no flooding.
This is likely do the fact that ABI has a large footprint as compared to Sentinel. However, VIIRS was also unable to see any flooding in that region due to clouds, as can be seen in the 1908UTC pass from 16 July 2019.
If one looks at the NWS Weather Forecast Office Lake Charles, LA River map page, one sees that there is flooding in that region.
Image from NWS Weather Forecast Office Lake Charles, LA River map page, taken at 12:53pm CDT on 16 July
This would corroborate the observations from the Sentinel SAR data. Utilizing the Sentinel data, which is being routinely provided to NOAA from ESA, it is hoped that value added SAR products, such as a flood map extent, can be developed for more routine flood monitoring in the future.

