« Back to "Typhoon Kammuri - November 28 - December 2 2019"
Typhoon Kammuri on 1 December 2019
Posted: December 1, 2019
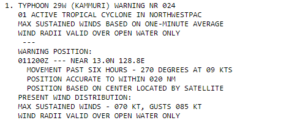
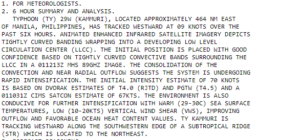
On 1 December 2019, Typhoon Kammuri strengthen slightly over the last 24 hours, with winds as of the 1500Z Joint Typhoon Warning Center (JTWC) discussion, of 70knts, or ~80mph. This would make it just barely a Category 1 storm in the Atlantic basin at that time.
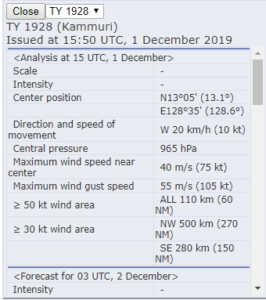
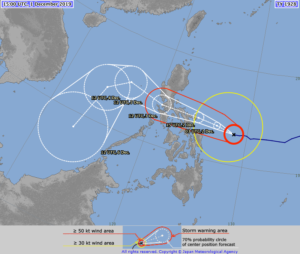
The Regional Specialized Meteorological Center (RSMC) Tokyo stated that the maximum winds at the center were 75knts or ~86mph at 1550UTC. While slightly different than the speed the JTWC showed, this difference is due to differing methods of determining the winds and due to the fact that JTWC adopts a 1 min mean wind speed, but RSMC Tokyo adopts 10 mins mean wind speed. If one used the JMA wind speed for your tropical system classification, Kammuri would be considered the equivalent of a Category 1 storm in the Atlantic basin.
As previously mentioned, while this doesn’t affect forecasts for this storm, this sort of difference in measurement could mean the difference between a tropical storm warning or a hurricane warning depending on the location you are using for your forecast and warnings.
NOAA-20 first saw Typhoon Kammuri at ~1636Z on the western side of the pass for the satellite. The first thing that could be seen in the I05 (11μm) imagery was a more organized, with the convection wrapping into the circulation.
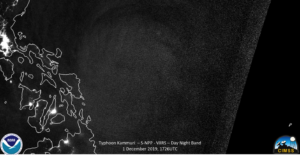
The Day Night Band (DNB) revealed many interesting features as well, including a lone lightning streak in the northwest quadrant of the storm.
In addition, the signal from the airglow (the moon was at waxing crescent with 24% illumination) also revealed mesospheric gravity waves along what appears to be a more obvious circulation becoming observable.
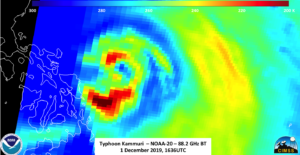
Despite Kammuri being on the edge of the ATMS instrument was able to observe the low and mid-level circulations in the 31.4GHz to the 88.2GHz. As can be seen, even with the coarse resolution of the ATMS instrument, one can easily see the circulations are very near each other.
In addition, the 88.2GHz revealed that the circulation was nearly encompassed by convection.
S-NPP observed Kammuri at approximately 1726Z on the eastern side of the pass. Unfortunately due to the differences in processing of the DNB between S-NPP and NOAA-20 and the location of the storm, there was not a lot of signal in the DNB imagery.
However, the high resolution I05 (11μm) imagery continued to show the convection wrapping into the circulation, though it has moved both in space and where the feeder bands are located as compared to the NOAA-20 pass 20 minutes prior.
Also similar to the NOAA-20 pass are the 88.2GHz from ATMS which shows convection at the lower levels surrounding the low level circulation.
It is important to note that because the S-NPP imagery was on the edge of the scan, there are parallax and edge effects which make it seem like the storm moved to the east rather than the west in the S-NPP imagery.
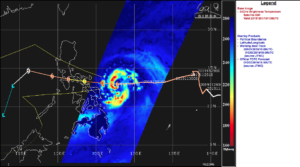
AMSR2 was also able to observe Kammuri on the western side of the pass in between NOAA-20 and S-NPP at approximately 1643UTC . Even with the parallax effects due to it being on the edge of the scan, one can still get an idea of the structure of the storm, detailing the location of the circulation in the low and mid levels. This is done by looking at the 23.8 and 88.9 GHz brightness temperatures. Unlike the last several days, the circulations in the two channels are extremely close to being on top of each other
In addition, the 88.9 GHz brightness temperature reveals that the tight convective bands are surrounding the low level circulation. This is consistent with the Joint Typhoon Warning Center (JTWC) prognostic reasoning at 15UTC, which utilized imagery from the Microwave Humidity Sounder (MHS) at ~1213 UTC, which mean it was taken from MetOp-A, based on the orbital tracks for 1 December.
They stated that:
THE CONSOLIDATION OF THE CONVECTION AND NEAR RADIAL OUTFLOW SUGGESTS THE SYSTEM IS UNDERGOING
RAPID INTENSIFICATION.
This is supported by the fact that by the 21Z analysis from the JTWC, Kammuri had winds of 80knts, or ~92mph. This would making it a strong Category 1, nearly Category 2, storm in the Atlantic basin. In addition, the Joint Typhoon Warning Center (JTWC) prognostic reasoning at 21UTC utlized the 37GHz from the Global Precipitation Measurement (GPM) Microwave Imager (GMI), which showed a well defined eye in the microwave imagery. This can be seen in the screenshot from the CIMSS Tropical Cyclone website below
The use of GMI in the JTWC discussion is likely due to better timing as compared to AMSR2 with respect to the the 21UTC forecast discussion.
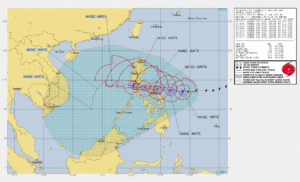
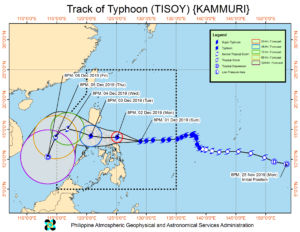
The forecast from JTWC and JMA has Kammuri continuing to slightly intensify through the next 24 hours, before weakening as it heads towards the Philippines, eventually making landfall on Tuesday, 3 December 2019.
Philippine Atmospheric, Geophysical and Astronomical Services Administration (PAGASA) continue to track Kammuri in order to assess the impacts on the various islands in the path of the storm, with their forecast being similar to JTWC and JMA
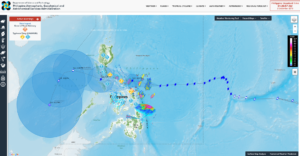
In anticipation of the storm, PAGASA has continued to issue flood alerts to various locations. This is especially important due to the fact most of the population is along the coast and in low-lying areas.

