« Back to "Typhoon Kammuri - November 28 - December 2 2019"
Typhoon Kammuri on 30 November 2019
Posted: November 30, 2019
As a important note, since Kammuri has now entered the Philippine Area of Responsibility, defined by the World Meteorological Organization, the Philippine Atmospheric, Geophysical and Astronomical Services Administration (PAGASA), it has been assigned a parallel name of “Tisoy”. The rational is that it is felt that Filipinos will respond more to familiar names and that it helps to underscore that these named weather disturbances pose a direct threat to the country. However, for the purposes of these discussions, the international recognized name designated by the Regional Specialized Meteorological Center (RSMC) Tokyo will be used.
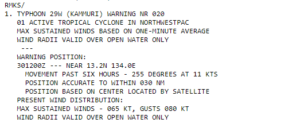
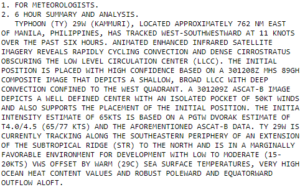
On 30 November 2019, Typhoon Kammuri weakened over the last 24 hours, with winds as of the 1500Z Joint Typhoon Warning Center (JTWC) discussion, of 65knts, or ~74mph. This would make it just barely a Category 1 storm in the Atlantic basin.
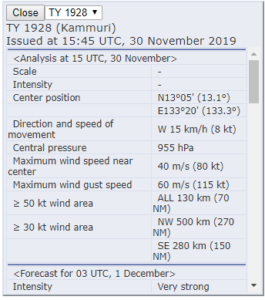
The Regional Specialized Meteorological Center (RSMC) Tokyo stated that the maximum winds at the center were 80knts or ~92mph.. While slightly different than the speed the JTWC showed, this difference is due to differing methods of determining the winds and due to the fact that JTWC adopts a 1 min mean wind speed, but RSMC Tokyo adopts 10 mins mean wind speed. If one used the JMA wind speed for your tropical system classification, Kammuri would be considered the equivalent of a Category 1 storm in the Atlantic basin.
As previously mentioned, while this doesn’t affect forecasts for this storm, this sort of difference in measurement could mean the difference between a tropical storm warning or a hurricane warning depending on the location you are using for your forecast and warnings.
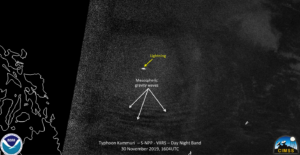
S-NPP first saw Typhoon Kammuri at ~1604Z on the extreme western side of the pass for the satellite. The I05 (11μm) imagery continued to show a large central dense overcast (CDO) that would obscure the low-level circulation. Several prominent features in the CDO include tropospheric gravity waves along with multiple overshooting tops.
In addition, while this normally would be in the “noisy” part of the scene for the Day Night Band on S-NPP, there was still enough signal from the airglow (the moon was at waxing crescent with 16% illumination) to see mesospheric gravity waves along with a single lone lightning streak within the CDO.
Owing to the position of Kammuri, the ATMS instrument was not really able to observe the low and mid-level circulations.
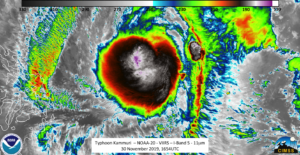
NOAA-20 observed Kammuri at approximately 1654UTC, though it was close to nadir allowing a better observation of the storm with multiple sensors. Like S-NPP, the CDO, along with features such as the tropospheric gravity waves and multiple overshooting tops were easily observed in the high resolution I05 (11μm) imagery.
Also, unlike previous days, several feeder bands can be seen in the IR imagery as well as an almost comma-shape to the large central dense overcast (CDO). In addition, multiple mesospheric gravity waves could be observed in the Day Night Band imagery.
It is also worth noting that it appears there are two sets of distinct gravity waves that merge into each other south of Kammuri
However, as can be seen in both the S-NPP and NOAA-20 passes, the central dense overcast would obscure any low level circulation. Even when using the 2.5 minute target sector from Himawari-8 over Kammuri (image from the CIMSS Satellite Blog), it is hard to see the low level circulation due to the rapidly evolving and cycling convection along with the dense cirrorstratus from the storm.
AHI Imagery, courtesy of the CIMSS Satellite Blog (credit Scott Bachmeier and Scott Lindstrom)
Given that AMSR2 was out of position for both the morning and evening passes on 30 November means that one must either rely on other sensors, such as MHS, or coarse resolution imagery from ATMS. as can be seen in comparing the 31.4GHz to the 88.2GHz, one can see that the low(er) level circulation (31.4 GHz) to the mid-level circulation, that it was a broad area of ciculation with the convection on the western side.
This is consistent with the Joint Typhoon Warning Center (JTWC) prognostic reasoning at 15UTC , which utilized imagery from the Microwave Humidity Sounder (MHS) at ~1209 UTC, which would be from MetOp-B.
One disadvantage of the MHS is that it only provides information from 89 to 190 GHz, missing out on information from other parts of the atmosphere that could indicate shear in the storm.
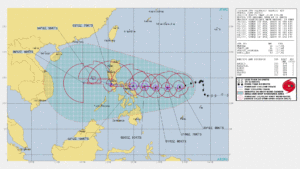
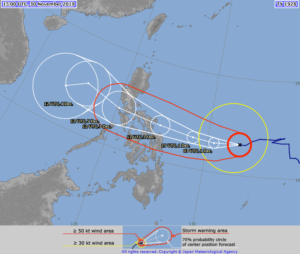
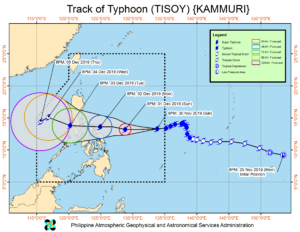
The forecast from JTWC and JMA has Kammuri continuing to slightly intensify through Sunday, 1 December 2019, before weakening as it heads towards the Philippines, eventually making landfall on Tuesday, 3 December 2019.
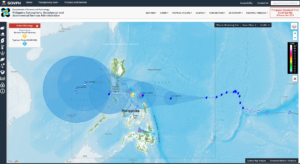
Philippine Atmospheric, Geophysical and Astronomical Services Administration (PAGASA) continue to track Kammuri in order to assess the impacts on the various islands in the path of the storm, with their forecast being similar to JTWC and JMA
In anticipation of the storm, PAGASA has continued to issue flood alerts to various locations. This is especially important due to the fact most of the population is along the coast and in low-lying areas.

