« Back to "2019 California Wildfiles"
Kincade Fire and California power outages on 30 October 2019
Posted: October 30, 2019
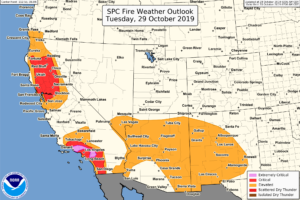
Over the last 5 days, the dangerous Kincade fire, which is near Geyserville in Sonoma County, has burned over a significant region, expanding due to dry conditions and strong winds. This combination of high winds and dry weather is a reason the National Weather Services’ Storm Prediction Center to issue an “extremely critical” fire weather outlook.
Image from NWS Storm Prediction Center Facebook page on 28 October 2019 at ~3:47pm PDT
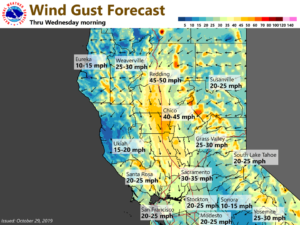
Winds for the region were predicted to be extremely high, as shown in this info-graphic from the NWS Forecast Office in Sacramento, CA.
Image from NWS Forecast Office Sacramento, CA website on 28 October 2019 at ~3:47pm PDT
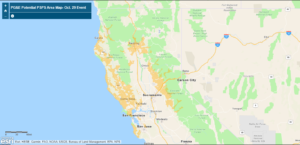
As mentioned on 26 October, Pacific Gas and Electric (PG&E) planned to cut off power to customers due to winds reaching in excess of 80 mph. This has continued through to 30 October 2019, per PG&E. The screenshot below, taken at 2:43pm PDT on 29 October 2019,shows the area where PG&E planned to cut off power to try and prevent new wildfires from starting. This is what is being called a Public Safety Power Shutoff (PSPS) event. PG&E has set up an interactive map here that shows the ares that will be impacted.
Image from Public Safety Power Shutoff (PSPS) event page on 29 October 2019 at ~3:43pm PDT
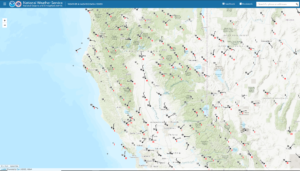
As seen by the National Weather Service’s Weather & Hazards Data Viewer website, at the ~3:00am, winds were slightly stronger than to be light over the state of California in the previous morning, which means there is more chance for fire growth
Screenshots from National Weather Service’s Weather & Hazards Data Viewer website on 29 October 2019 at ~3:00am PDT
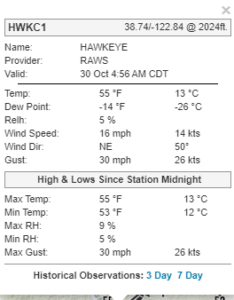
The Hawkeye RAWS station near the Kincade fire showed stronger winds than roughly 24 hours prior, with gusts close to 30mph
Screenshot from National Weather Service’s Weather & Hazards Data Viewer website on 30 October 2019 at ~2:56am PDT (4:56am CDT)
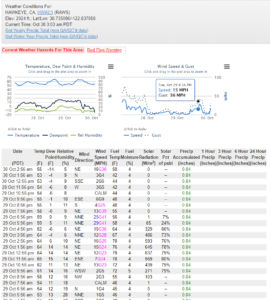
Of also to note are the extremely low dewpoints, which enhance the fire risk due to the air being so dry. It is also worth showing that on the evening of 29 October 2019, there were reported wind gust of just over 40 mph
Screenshot from National Weather Service’s Weather & Hazards Data Viewer website on 30 October 2019 at ~3:05am PDT
As of the 7:36am PDT on 30 October, CalFire reported that the fire had more than doubled in size, and was approximately 76,825 in size and was now 30% contained. At least 206 structures destroyed with 2 injuries confirmed. Not that this was not a large increase in size from the previous day, when the size of the fire was 75,415 acres. This slower growth is likely due to the weaker than forecast winds.
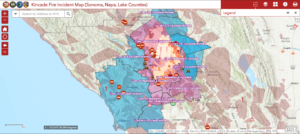
There are still large portions that are under a mandatory evacuation notice. However, most of Sonoma County all the way to the Pacific Ocean and into Napa Valley are either in a mandatory evacuation or an evacuation warning. This can be seen in the screenshot below from the Sonoma County Incident Map from 29 October 2019 at ~3:51pm PDT showing the evacuation areas around the Kincade fire
Screenshot from the Sonoma County Incident Map website on 29 October 2019 at ~3:51pm PDT
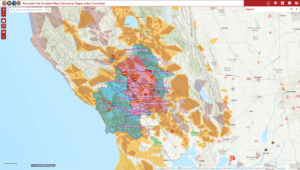
As of 8:18am PDT on 30 October, the evacuation areas remain very similar
Screenshot from the Sonoma County Incident Map website on 30October 2019 at ~8:18am PDT
This shows that there are mandatory evacuations into the town of Healdsburg and encroaching on Santa Rosa, CA.
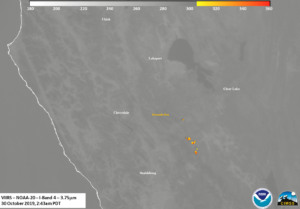
The Kincade Fire was first observed by NOAA-20 at ~2:43am PDT (0943 UTC), which caught the fire close to nadir. This meant that the satellite was able to observe the fire with the best possible view, eliminating the edge of scan effects. The most obvious thing when one looks at the I04 (3.75μm) channel is that it appears that the most intense part of the fire is still the northern and eastern parts of the fire. This is where the brightest I04 (3.75μm) brightness temperatures occurred.
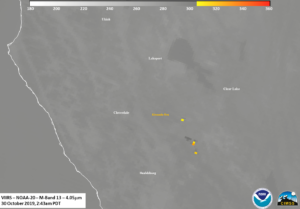
In this case, the lower resolution (750m) dual-channel, M13 (4.05μm) is still useful to determine the temperature of the fire
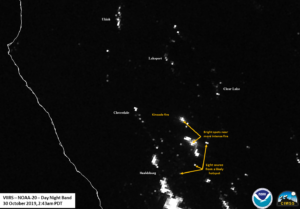
The Day Night Band, which had no illumination due to it being a waxing crescent moon (1% illumination), had a bit of blooming, possibly due to the thermal effects of the fire in the DNB, as previously discussed. In addition, some emitted light from some of the smoldering fires in the area of the fire that may not be visible in the imagery or the Active Fire product.
S-NPP observed the Kincade fire at ~3:33am PDT (1033UTC) on 30 October, on the western side of the pass. It is important to note that because the fire is at elevation, there are some parallax effects due to it being on the edge of the scan, despite the terrain correction applied to the geolocation data. This can be seen below in the I04 (3.75μm), M13 (4.05μm), M11 (2.25μm), Day Night Band and finally the VIIRS Active Fire Products.
The take away from these images fire was primarily regulated to areas of steeper terrain that is harder to access for firefighter but not changing significantly in size.
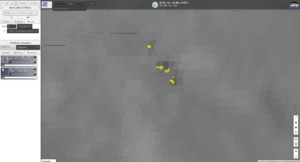
Another way to visualize the VIIRS Active Fire product as processed by CSPP is via the RealEarth viewer. The following link displays the last 6 VAF product timesteps overlaid on top of the corresponding GOES-17 Band 7 (3.9um) channel from the CONUS scans. An example screen shot below is taken from the 0941 PDT pass
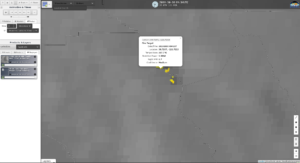
Screenshot from RealEarth on 30 October 2019 at ~3:15am PDT
The color of the hot spots (circles) corresponds to the Fire Radative Power, with yellow being a less intense fire to red being more intense. One can also probe each hotspot to give the exact location as well as radative power and confidence of the fire
Screenshot from RealEarth on 30 October 2019 at ~3:17am PDT
This is one way of comparing what is seen in GOES verse the higher resolution VIIRS Fire product. In addition, since this is displaying data from direct broadcast, this provides users with high resolution information with very low (less than 30 minute) latency.
Power outages
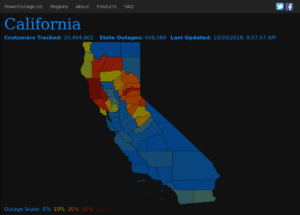
At ~3:10amPDT, shortly after the the near-nadir NOAA-20 overpass of California, roughly 446,089 customers were without power, primarily in northern California, as seen in the screenshot from poweroutage.us, with virtually all of them being from PG&E. That is roughly the same number as 29 October 2019. To put it in terms of percentages, that would be 8% of all PG&E customers (~5.2million customers total) and about 4% of all customers in all of California (~10.5 million customers total). This is a significant amount less than yesterday, but still affecting similar regions
Screenshots from poweroutages.us on 30 October 2019 at ~3:10am PDT
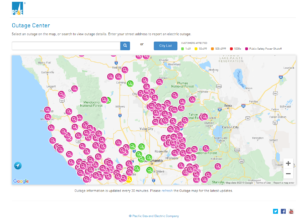
Outages from the Pacific Gas and Electric outage website taken at approximately 3:03am PDT this morning also showed a similar distribution of outages.
Screenshots from PG&E’s Outages tracker website on 29 October 2019 at ~3:03am PDT
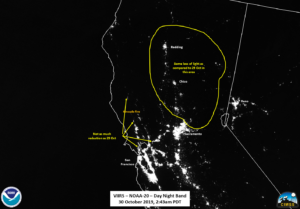
Utilizing the NOAA-20 pass from ~3:01am PDT on 29 October 2019 the comparison between the imagery from the morning of 23 October 2019 showed a significant decrease in light in the areas had their power shut off.
This shows that the areas are consistent with the outage trackers. It is also worth noting the comparison with 29 October 2019, which shows the change in who was affected by the PSPS.
As of the fire incident update at 7am PDT, CalFire noted that the eastern part of the fire was active overnight, something seen in the satellite imagery. However, firefighters as a whole have continued to make forward progress in fighting the fire, though access to the northern part of the fire continue remains challenging because of steep terrain and narrow roads. While Red Flag conditions will continue through the morning, the forecast shows more favorable firefighting weather conditions within the next few days. Approximately 5,001 personnel are assigned as of the 7am update with 27 helicopters working fire suppression.

