« Back to "Tropical Storm Nestor"
Tropical Storm Nestor from 19 October 2019
Posted: October 19, 2019
This morning at 0600Z on 18 September, Tropical Storm Nestor had winds of 50mph, according to the National Hurricane Center, Nestor was gradually losing it’s characteristics as a tropical system.
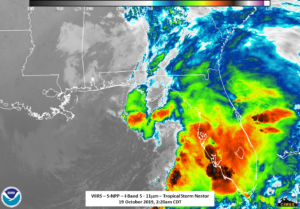
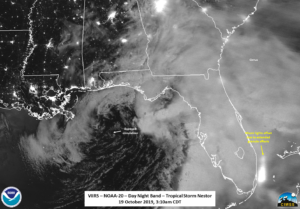
At ~0720 UTC (~2:20am CDT), Suomi-NPP (S-NPP) caught then Tropical Storm Nestor with a near nadir overpass, allowing for the Day Night Band (DNB) to capture the storm top features in the Waning Gibbous moon ( 71% illumination). Several features could be see, including overshooting tops and tropospheric convectively gravity waves as well as a single lightning streak off the Space Coast
If you zoom in over the Florida panhandle, several other features are revealed. Now, if you looked at the I05 (11μm) brightness temperatures, one might think the center of circulation was just south of Apalachicola, FL.
However, the 0600Z public forecast stated it was 140 km to the southwest of Apalachicola, FL. If you looked at the zoomed in moonlit DNB imagery, you could see the circulation off shore and away from the main part of the convection
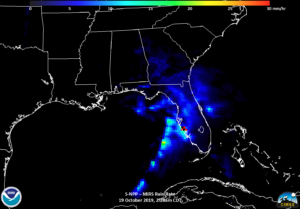
It is also interesting to note the glint off the cirrus clouds just south of South Carolina. The ATMS MiRS rain rate product showed that the location of the rain was very broad with only a few areas of intense rain along the western Florida coast, as can be seen in the zoomed out imagery shown below
The ATMS 88.2 GHz brightness temperature showed large amounts of warm air surrounding the storm with the coldest temperatures only associated with the convection along the coast. This was also seen by the AMSR2 88.9 GHz BTs about 15 minutes prior to the S-NPP pass (~0704 UTC or ~2:04am CDT)
It is also worth noting that the 23.8 and 89.0GHz imagery also showed a hint of a circulation well off the coast, though the exact location is a bit skewed due to it being on the extreme edge of the AMSR2 pass
NOAA-20 did see Nestor on the extreme eastern edge of the VIIRS pass. This means that features were offset, especially in the extended granule portion of the Day Night Band data. This includes the scattered lights from Miami being offset into the ocean. This is an artifact of the extended granule but something users should be aware of when using Day Night Band
However, one could still see the rotation of the I05 (11μm) imagery
And in the DNB, one could see the progression of the glint from off the coast of South Carolina in the NPP imagery moving westward to Mississippi in the NOAA20 imagery
The exposed circulation could also be seen in both the DNB and I05 (11μm) imagery
This is interesting, since the 0900Z (4am CDT) NHC forecast discussion from the National Hurricane Center at 19 October pointed out.
Nestor is rapidly losing the few tropical characteristics that it
once had.  The cloud pattern consists of a large circulation of low
clouds with a comma-shape convective band well to the east of the
circulation.  This band is already over a large portion of the
Florida peninsula.  The center of the system or the area of minimum
pressure could be anywhere within this gyre, and the precise
location is uncertain.
But as pointed out above, one could see it in the DNB visible-at-night imagery
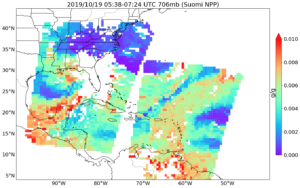
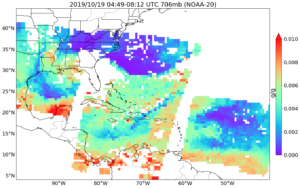
Another useful tool for forecasting could be the 2-dimensional slices of water vapor mixing ration from NOAA Unique Combined Atmospheric Processing System (NUCAPS). The NUCAPS water vapor at low levels (706mbar) from the morning passes of S-NPP and NOAA-20 showed quite a bit of low-level dry air (blue) coming into the western side of Nestor, as can be see in the images below. In addition, one can see the storm pushing against an area drier air to the north.
This data utilizes Direct Broadcast antennas in Miami and Puerto Rico to give a broad view of the situation in the tropics in real-time. This intrusion of dry air could be a factor in the weakening of Nestor, which became a post-tropical cyclone at 1500Z on 19 October as it lost its tropical characteristics.
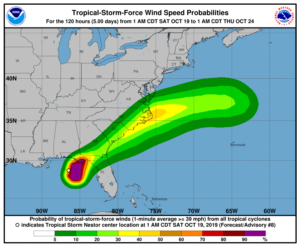
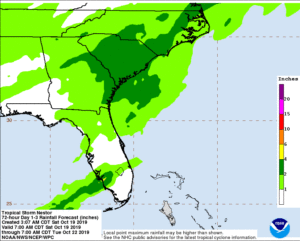
As of the 7am CDT advisory, Nestor was forecast to impact the southeast United States.
Warning cone, wind forecast and rain totals taken from NHC Graphics page for Tropical Storm Nestor on 19 October 2019 at 7:00am CDT
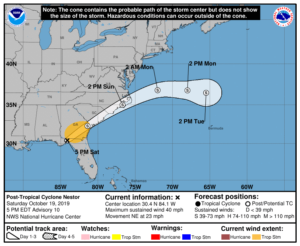
This track is similar to the last advisory for Nestor, which occurred at 4:00pmCDT (2100UTC).
Warning cone taken from NHC Graphics page for Tropical Storm Nestor on 18 October 2019 at 3:50pm CDT
While this is not a major national level incident and is no longer a tropical system, stakeholders, such as FEMA region IV, are currently monitoring the situation for impacts to the Gulf Coast such as flooding and other impacts.


