« Back to "Super Typhoon Hagibis - October 6-13 2019"
Super Typhoon Hagibis on 10 October 2019
Posted: October 10, 2019
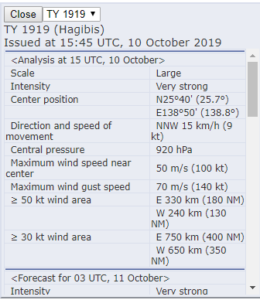
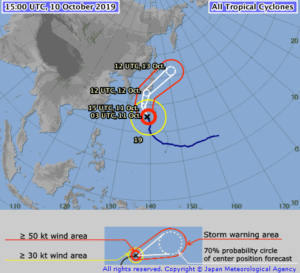
At 1500Z on 10 October, the Joint Typhoon Warning Center (JTWC) stated that Super Typhoon Habigis had sustained winds of 130knts or ~150mph. This is the equivalent of a Category 4 storm in the Atlantic basin.
The Regional Specialized Meteorological Center (RSMC) Tokyo stated that the maximum winds at the center were 100knts (~100mph). The difference is due to differing methods of determining the winds and due to the fact that JTWC adopts a 1 min mean wind speed, but RSMC Tokyo adopts 10 mins mean wind speed.
As previously mentioned, while this doesn’t affect forecasts for this storm, this sort of difference in measurement could mean the difference between a tropical storm warning or a high wind warning
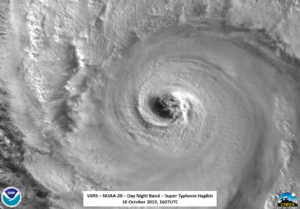
NOAA-20 first saw Super Typhoon Habigis at ~1607, just off of nadir on the western side of the scene. The waxing gibbous moon (90% illumination) was high enough over the horizon to provide a look well into the large (~62km wide) eye of the storm were very obvious mesovortices could be found.
In addition, the intense convection and associated tropospheric gravity waves could be seen in both the DNB and the I05 (11μm) imagery.
The ATMS 88.2GhZ imagery showed the convection heavily favoring the eastern half of the storm, though the circulation was completely surrounded. The 31.4Ghz imagery showed colder air on the western part of the storm.
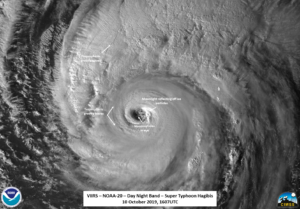
S-NPP observed Habigis on the eastern part of the part of the pass at ~1657Z, leading to an change in the shape of the eye as well as providing some unique lighting in the DNB, with some moonlight possibly reflecting off of ice particles in the eastern part of the eyewall.
In both cases, the VIIRS imagery shows that Habigis has retained the characteristics of an intense tropical cyclone.
The two successive passes provide the opportunity to see unique features such as reflection from ice in the eyewall rotating (slightly) between two successive passes.
While VIIRS provides high resolution imagery, it is also good to remember that it does not have a water vapor channel. This 16 panel image of Super Typhoon Habigis from 9 October at 0300Z (courtesy of the CIMSS Satellite Blog) shows how the storm looks in the visible, near infrared, infrared and water vapor imagery. This provides forecasters more information on if, for example, dry air is being ingested into the storm. Other products from other sensors, such as NUCAPS can be used to diagnose water vapor closer to the surface.
Image courtesy of the CIMSS Satellite Blog
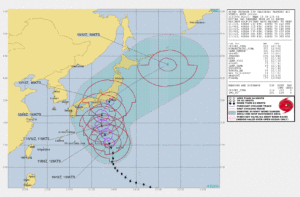
The forecast from JTWC and JMA continue to have it impacting Japan on 12 October. Habigis continues to be a concern to the main island of Japan through the weekend. As with all tropical systems, there is the potential for heavy rains and flash flooding.


